OBIEE’s Systems Management component exposes configuration and performance data through Java MBeans. As discussed in other posts these can be be accessed through several different ways:
- JConsole (see also here)
- oc4j
- Windows PerfMon (although I guess this isn’t actually using MBeans/JMX?)
- saw.dll?perfmon
- BI Management Pack
Since it’s a standard java technology being used we can in theory use anything that is designed for monitoring mbeans via jmx. Doing some Googling I discovered jManage.
JManage (homepage / SourceForge project page) describes itself thus:
jManage 2.0 is an open source application management platform, which provides a centralized console for managing application clusters and distributed-application environments
The latest version is a Release Candidate (RC) from 2007, and whilst the website’s forum isn’t entirely a ghost town it’s evidently not in active development.
Installing JManage on Windows 🔗
(This is a bare-bones installaion and what I did to get something up and running - it is probably not how it should be done)
-
Unzip the downloaded archive somewhere
-
From the command line run bin/startup.cmd
-
Enter the default password 123456 when prompted
-
Assuming you don’t get any errors go to http://localhost:9090/ where you should get a login page.
-
Login at admin / 123456
-
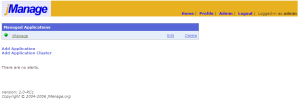
You should get a list of Managed Applications with one entry, jManage
Adding OBIEE to jManage 🔗
NB: If you have separate BI and PS servers you’ll need to monitor both, as the performance data is local
-
This assumes that you installed Systems Management when you installed OBIEE. If in doubt have a look for [OracleBI home]/systemsmanagement
-
In [OracleBI home]/systemsmanagement edit the runagent.cmd (or .sh if it’s a unix installation) to make the data accessible remotely as follows:
On the
java_cmdline replace-Dcom.sun.management.jmxremotewith-Dcom.sun.management.jmxremote -Dcom.sun.management.jmxremote.port=9980 -Dcom.sun.management.jmxremote.authenticate=false -Dcom.sun.management.jmxremote.ssl=false(See here for more information on configuring jmx)
-
Start the agent by running runagent.cmd (or .sh if it’s a unix installation). You should get this kind of output:
[…]
Analytics JMX Agent
Started… 29-Jul-2009 09:01:32 oracle.bi.analytics.management.monitoring.AppPerfMon refresh INFO: Oracle BI Presentation Server has started. Perfcounter data is collected. 29-Jul-2009 09:01:32 oracle.bi.analytics.management.monitoring.AppPerfMon refresh INFO: Oracle BI Server has started. Perfcounter data is collected.
-
If you want to be sure it’s working, use jconsole to connect and examine the MBeans exposed. See here for more information
-
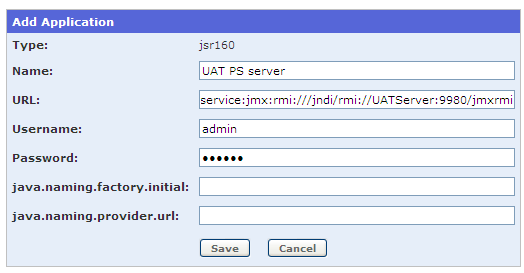
In jManage click on Add Application (if you can’t see this make sure you’re on the http://localhost:9090/config/managedApplications.do page)
-
Choose JSR160 as Application Type
-
Enter a description name for your server, and then for the URL this:
service:jmx:rmi:///jndi/rmi://YourServer:9980/jmxrmi(nb 9980 is the port specified in the runagent.cmd script, so change this if need be)
-
Leave Username, Password, java.naming.factory.initial and java.naming.provider.url as they default to on the form
-
Click Save
-
If it’s worked then you should be back at the Managed Applications page with your server listed and hopefully a green icon next to it, indicating that jManage has successfully connected
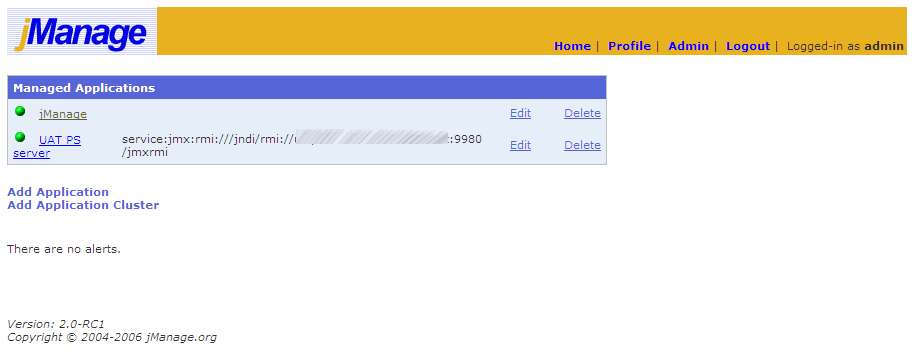
NB: There seems to be a bug in adding an application to jManage which might catch you out. If you copy and paste the service URL you get a space appended to the end, which means your application gets added but jManage can’t connect to it (so lists it as down / red icon). If you examine the console you’ll see this:
29-Jul-2009 11:07:27 org.jmanage.core.management.ServerConnector getServerConnection INFO: Failed to connect. error=Failed to retrieve RMIServer stub: javax.naming.NameNotFoun dException: jmxrmi
If you edit the application to remove the trailing space from the URL you’ll see in the console that it doesn’t retry the URL, so I’m guessing doesn’t register the removal of the space. The workaround is to delete the application and re-add it, being careful not to include the trailing space.
Exploring jManage & OBIEE 🔗
Current performance numbers 🔗
From the application page, enter click on Find Managed Objects (leaving the filter as *:*). You’ll get a list of MBeans which will be familiar if you’ve already explored MBeans through jconsole or oc4j.
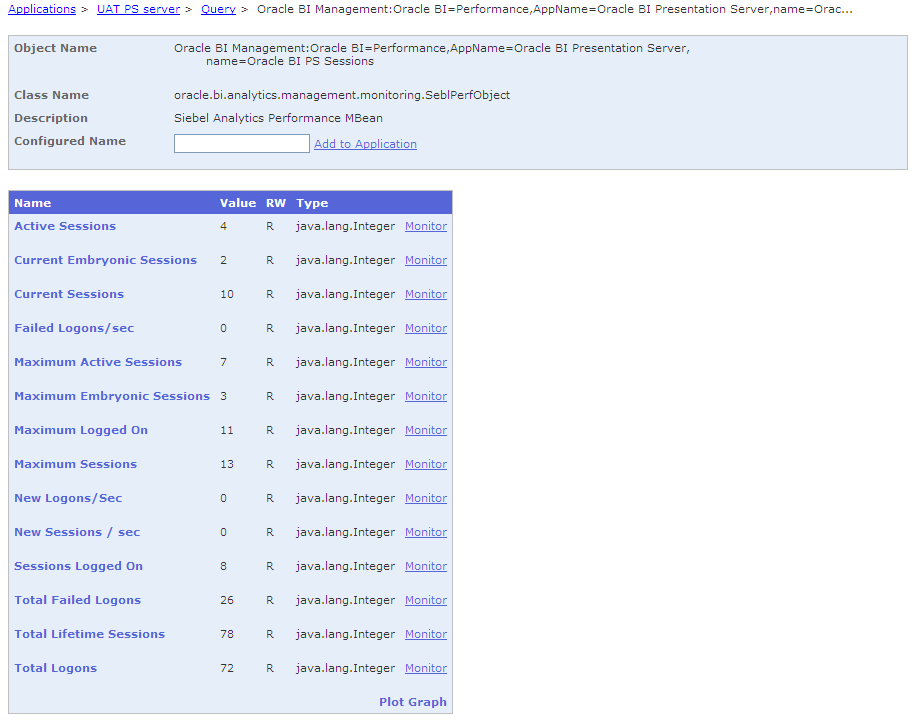
Click on like Oracle BI=Performance,AppName=Oracle BI Presentation Server,name=Oracle BI PS Sessions and you’ll get a list of the current values of session metrics within Presentation Services
Graphing performance 🔗
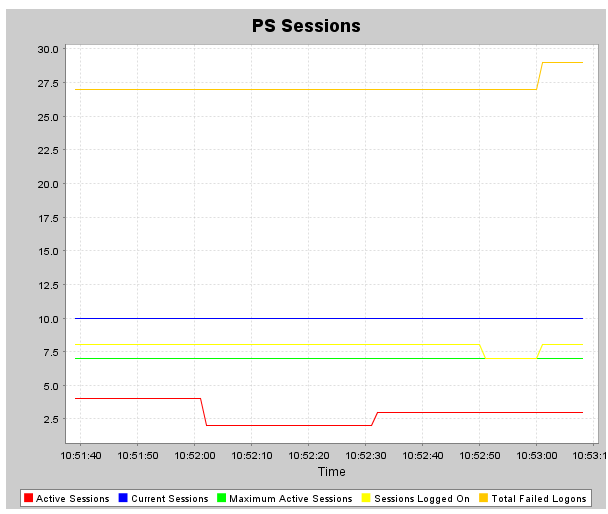
Now click on Plot Graph (bottom right corner of the metrics list box) and tick a handful of metrics to graph. Click on Next. Enter a name for the graph and a polling interval, and click on Save.
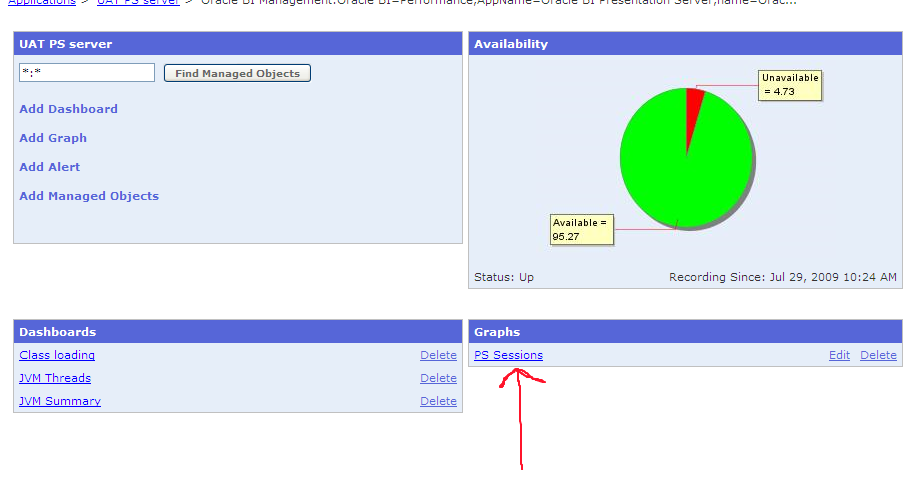
You’ll get taken back to the main application page, where you should now have Graphs box, with your newly created graph listed underneath. Click on the graph name.
You’ll get a java applet firing up for the graphing. The graph applet has a context menu (right click) through which you can customise its appearance.
You can graph across metric groups (eg. Sessions and Cache) by selecting Add Graph from the main application page.
See here for jManage graph reference
NB: You might get a blank graph (with no legend for the metrics you selected). If this is the case then go back to the command window where you started jManage from and you’ll probably see an error:
29-Jul-2009 10:41:38 org.mortbay.jetty.servlet.ServletHandler handle WARNING: Error for /app/fetchAttributeValues.do;jsessionid=2an2geo5rpuib java.lang.AssertionError at org.jmanage.webui.actions.app.MBeanAttributeValuesAction.execute(MBeanAttribute ValuesAction.java:76)
This highlights that jManage is not a finished product (nor does it claim to be), so bear this in mind when considering investing time in it. It looks like in this instance the New Logons/Sec object was causing the failure, and it’s the only one with a value of zero so maybe that caused the error?? But another object, Completed Requests/sec, has a value of zero but graphs successfully. Looking at the output of runagent.cmd shows:
java.lang.NullPointerException at oracle.bi.analytics.management.monitoring.SeblPerfObject.getAttribute(SeblPerfObject.java:371) at oracle.bi.analytics.management.monitoring.SeblPerfObject.getAttributes(SeblPerfObject.java:510) at oracle.bi.analytics.management.monitoring.SeblPerfObjectInstanceMBean.getAttributes(SeblPerfObjectInstanceMBean.java:148) at com.sun.jmx.mbeanserver.DynamicMetaDataImpl.getAttributes(DynamicMetaDataImpl.java:125) at com.sun.jmx.mbeanserver.MetaDataImpl.getAttributes(MetaDataImpl.java:189) at com.sun.jmx.interceptor.DefaultMBeanServerInterceptor.getAttributes(DefaultMBeanServerInterceptor.java:696) at com.sun.jmx.mbeanserver.JmxMBeanServer.getAttributes(JmxMBeanServer.java:686) at javax.management.remote.rmi.RMIConnectionImpl.doOperation(RMIConnectionImpl.java:1389) […]
So to be fair to jManage it could be that OBIEE’s systems management isn’t honouring the exposed metric, but it would be nice if jManage ignored it and still showed the others, or flagged up the error.
Managed Objects 🔗
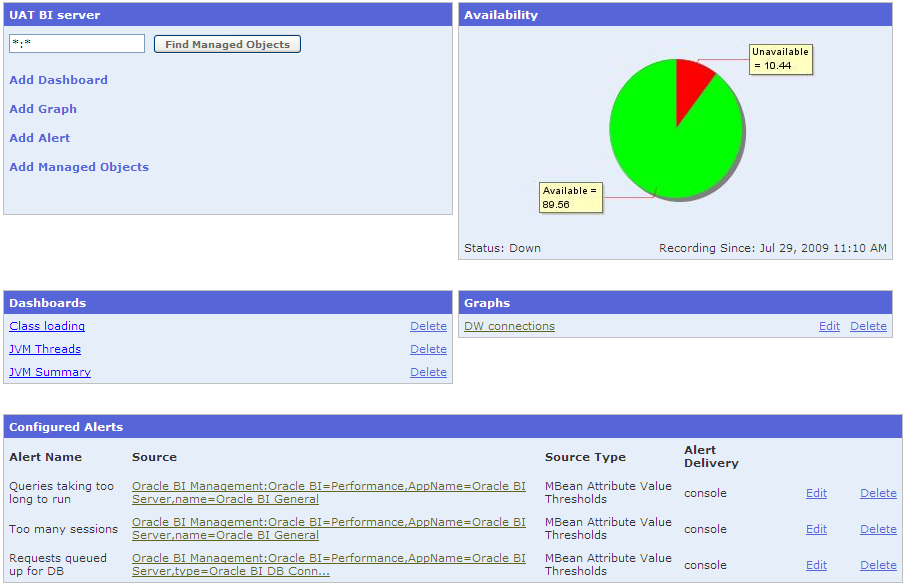
I think Managed Objects are a way of “bookmarking” specific MBeans for faster access from the dashboard for querying current values and defining graphs or alerts. For example, the object detailing performance data about our data warehouse connection pool, Oracle BI=Performance,AppName=Oracle BI Server,type=Oracle BI DB Connection Pool,name=Star_Oracle Data Warehouse_Oracle Data Warehouse Connection Pool, is going to be of more interest than all the Configuration objects, plus a bunch of performance objects that we probably won’t examine too closely that often. From the application page, click on Add Managed Object. Enter a display name next to the object(s) you’re interested in, and click on Add (at the bottom of the page).  Your new object is displayed on the application home page:
  from where you can click through to see the current metric values, and define a graph or alerts.
Alerting 🔗
You can define alerts which will fire to email and/or the jManage home page: 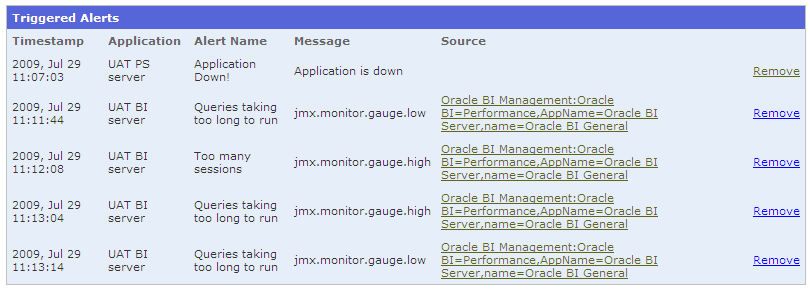 To do this click on Add Alert from the application page, or Monitor when browsing the Management Objects
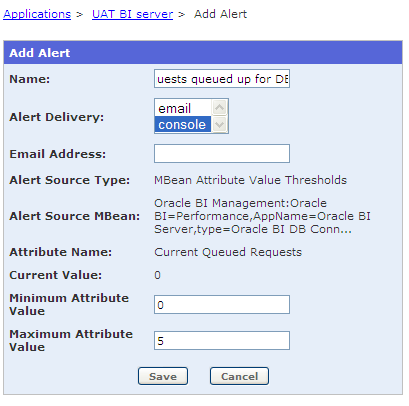
To use email alerts you need to update the Email properties section of jmanage.properties in the bin folder of jManage.
Application Clustering 🔗
Application Clustering is useful for defining groups of applications. They don’t have to actually be clustered. To set it up click on Add Application Cluster from http://localhost:9090/config/managedApplications.do
 The status of an application filters up, so for example if the BI server is marked as down then the parent application cluster is also marked as down.
This Clustering feature is very useful for being able to see side-by-side metrics from multiple OBIEE nodes: 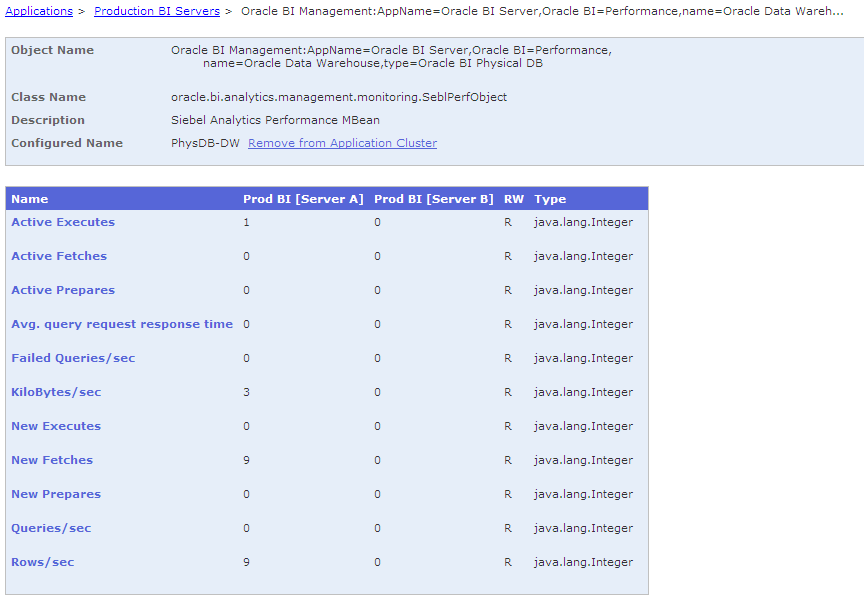
If graphing could be done at a cluster level that’d be even better :) (per this feature request)
Configuration 🔗
As well as performance data, OBIEE Systems Management mbeans expose all the configuration options. You can edit this through jManage (just as you can through jconsole or oc4j), but bare in mine that no backups are taken of the config files so you should be cautious when using this.
Further info 🔗
jManage documentation: http://www.jmanage.org/wiki/index.php/Documentation Errors are logged to the console and also logs/error.log in the jManage folder.
Further thoughts 🔗
The documentation details Dashboard development so it might be possible to build up a half-decent dashboard for assessing the overall OBIEE performance & status at a high level.
Threshold alerts on OBIEE mbeans could be logged and picked up by an enterprise systems management tool (although hopefully that tool could interface with jmx and the mbeans directly?)
The command line mode could be a way of extracting performance mbean values, although would a direct native java application be more appropriate for anything other than experimentation?
The graphing functionality in jManage - which would be one of the main reasons for using this instead of oc4j or jconsole for looking at the point-in-time numbers - is immature with frustrations like not being able add or remove metrics from an existing graph.
Bottom line 🔗
Whilst an unfinished product, jManage gives an interesting option to extending OBIEE performance monitoring and alerting. However, the BI Management Pack for Enterprise Manager is obviously the proper way to monitor OBIEE at the Enterprise level, and there’d have to be a really good reason to use jManage for monitoring OBIEE in anything other than an exploratory manner.
