My two earlier posts (here and here) detail the difficulties I had with LoadRunner (now called HP Performance Center). After a bit of a break along with encouragement from knowing that it must be possible because it’s how Oracle generates their OBIEE benchmarks I’ve now got something working. I also got a useful doc from Oracle support which outlines pretty much what I’ve done here too.
In essence what you do - and what the Metalink document 496417.1 states - is you use the Web (HTTP/HTML) protocol with URL-mode.
Here’s details about how I created a VUser script for testing OBIEE.
How-To
Recording Overview 🔗
Here’s how you’d record a simple login - run dashboard - logout scenario:
- Create a new VUser of Protocol type Web (HTTP/HTML) [File -> New… -> New Single Protocol Script -> Web (HTTP/HTML)]
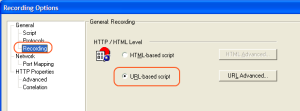
- Set Options as detailed in the “Recording options” section below
 - Set action to vuser_init
 - Record login
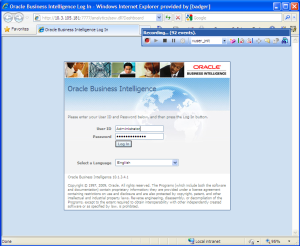 - Set action to Action
 - Record click to dashboard
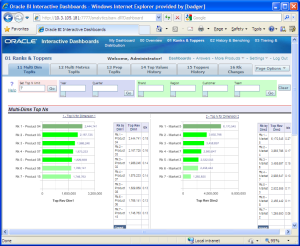 - Set action to vuser_end
 - Record logout
 - Save!
Press F5 to test the replay. A browser window should pop up showing the resulting pages, if it doesn’t go to Tools -> General Options -> Display -> Show browser during replay. Instead of F5 to play the whole scenario you can step through using F10.
Recording options 🔗
Most of these are set from Tools -> Recording Options, or from the Options button on the “Start Recording” window.
-
Protocol: Web (HTTP/HTML) [this is defined when you create your VUser script]
-
HTTP Properties -> Advanced -> Recording schemes -> Content Types, set to “Exclude content types in list” and set the list to:
- text/css
- image/gif
- image/png
- image/jpeg
- application/x-javascript
- application/x-shockwave-flash
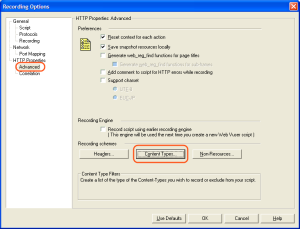

-
Copy this to a file called obiee.cor: [sourcecode language=“xml”]
Import this correlation file (see notes here for information about correlation) by going to Tools -> Recording Options -> Correlation -> Import. Optionally you can include an icon by downloading this image
 and converting it to bmp and saving it to C:\Program Files\HP\Virtual User Generator\dat\webrulesdefaultsettings\icons
  After importing the correlation file, untick all other applications in the correlation list except for OBIEE
Parameterisation 🔗
Using parameterisation we can change the action that was recorded navigating to a specific dashboard to instead navigate to any dashboard we want. Herein lies the power of the tool because complex and realistic loadtests can be created from a few carefully crafted building blocks.
Rename “Action” to “Navigate_to_dashboard” (Just change the name in the code, or right-click on the Action in the left-hand view and click Rename Action).
To parameterise, select the whole string (in this case “/shared/Sample Sales/_portal/02 History & Benching”), right-click and select “Replace with a parameter”.  Select a File parameter, and click Properties.
 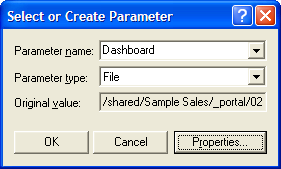 Click “Create Table”, and the value that you’d selected to “Replace with a parameter” should be added as the first entry. Populate the table with Add Row, or Edit with Notepad, to add the remaining Dashboard names.
  Set “Select next row” to Random, and then click on “Simulate Parameter” to see an example of the parameter value that will be picked on each iteration.
Your code should now look something like this:
[sourcecode language=“html”]
Navigate_to_dashboard() {
web_submit_data(“saw.dll_2”, “Action=http://10.3.105.181:7777/analytics/saw.dll?Dashboard”, “Method=POST”, […] ITEMDATA, […] “Name=PortalPath”, “Value={Dashboard}”, ENDITEM, LAST); return 0; } [/sourcecode]
On the “return 0;” line press F9 to insert a breakpoint, and then press F4 to bring up the runtime settings. Set number of iterations to 5 (or enough to cycle through the dashboards), and then click OK.  Press F5 to run and make sure on each breakpoint the dashboard has loaded (if the browser doesn’t load up then go to Tools -> General Options -> Display -> Show browser during replay). Press F5 to continue past the breakpoint.
Record new action - Navigate to report 🔗
We can now add a new function, navigate to a report within a dashboard. To do this click the Start Record button, untick “Record the application startup” and create a new Action by clicking New… 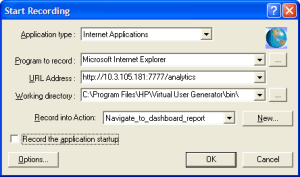 Recording will start paused (because we’ve already got a login and dashboard navigate script, we don’t need to record another).
 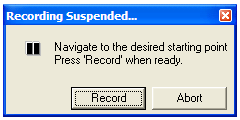 Login and navigate to a dashboard, and then click “Record”. Click on a dashboard report tab, and ensure that the recording windows shows and increased number of events captured. Once the report’s loaded, click the Stop button on the record toolbar. If you’ve not set exclude content types in recording options then you may need to strip out the static content and web_url calls to saw.dll?DocPart&_scid=faN65Op1PFg&StateID=18814381 which are the hardcoded unique chart IDs and no use to us.
You should have a single web_submit_data call, with ITEMDATA for PortalPath and Page representing the Dashboard and Report respectively. The Dashboard string should be replaced with the existing Dashboard parameter (select the whole string after Value= and right click, this time select “Use Existing Parameter”)  We now need to expand the parameter Dashboard to include the Reports within each dashboard (Dashboard:Report being a 1:* relationship). Press Ctrl-L to bring up the Parameter List and select the Dashboard parameter. Add a Column called Report.
  Click Edit in Notepad (or load it into your favourite text editor). For each dashboard repeat the line and add the report names next to it, thus:
  Save the file and check that it is loaded correctly into the Parameter window
  Click New on the left of the Parameter Window and give the parameter a name of Report. Click File path and set it to Dashboard, and set “Select column” “By number” to 2. Set Select next row to “Same line as Dashboard”:
Now highlight the report string in the script after Value= and chose “Replace with an existing parameter” and select Report. Set “return 0;” as a breakpoint line, and in Run-time settings (F4) increase the number of iterations to a handful. Press F5 to run the VUser and check in the browser window that the reports screens are loaded correctly.
Record new action - Drilldown 🔗
Let’s now record the action required for drilling on a report. Following the same steps as when we added the report navigation Action; Click the Start Record button, untick “Record the application startup” and create a new Action by clicking New… Login and navigate to a dashboard report and then click “Record”. In this example I was on “01 Ranks & Toppers” dashboard with the default report “11 Multi Dim TopNs”. I clicked on the value of Product 04 / Market 5 (657,882) and then “History Filtered”. Once the new report’s loaded, click the stop button on the recording toolbar. Remove the think time and web_url statements from the generated script if necessary. Examine the web_submit_data statement data, after the ITEMDATA line:
- PortalPath and Page is what we’d expect - the Dashboard and the Report within it.
- P1 and Action have values of “dashboard” and “Navigate” respectively, so kind of obvious but it would be interesting to know the other permutations
- P19 is either a unique ID or encoded value.
- P0 is interesting, and discussed next.
P0 is XML with backslash-escaped quotation marks (i.e. search and replace \" for "), and LoadRunner script breaks it over several lines. For each line break remove the double quotation marks either side, eg this:
[sourcecode language=“xml”] […] xmlns:xsi=“http://www.w3.org/2001/XMLSchema-instance">"D4 " “Product”.“P01 Product”</sawx: […] [/sourcecode]
becomes this:
[sourcecode language=“xml”] […] xmlns:xsi=“http://www.w3.org/2001/XMLSchema-instance">"D4 Product”.“P01 Product”</sawx: […] [/sourcecode]
The resulting XML after formatting looks like this, and is fairly self-explanatory. The data is the predicate for the report - an AND statement, specifying the values of “D4 Product”.“P01 Product” and “D2 Market”.“M01 Market”.
[sourcecode language=“xml”] <sawx:expr xsi:type=“sawx:logical” op=“and”> <sawx:expr xsi:type=“sawx:comparison” op=“equal”> <sawx:expr xsi:type=“sawx:sqlExpression”>“D4 Product”.“P01 Product”</sawx:expr> <sawx:expr xsi:type=“sawx:untypedLiteral”>Product 04</sawx:expr> </sawx:expr> <sawx:expr xsi:type=“sawx:comparison” op=“equal”> <sawx:expr xsi:type=“sawx:sqlExpression”>“D2 Market”.“M01 Market”</sawx:expr> <sawx:expr xsi:type=“sawx:untypedLiteral”>Market 5</sawx:expr> </sawx:expr> </sawx:expr> [/sourcecode]
XML Notepad is useful for this kind of work. You can paste the single-line XML statement and on the XSL Output tab see the reformatted version.
Since the values passed to the report are exposed in this manner, we can … guess what …. parametrise them! In the script remove the line breaks and extraneous double quotation marks as describe above so that P0 is all on one line. Then replace “Product 04” and “Market 5” with new File-based parameters (see above for details) for Product and Market respectively
Original:
“Name=P0”, “Value=<sawx:expr v1 “>expr “>expr “>xmlns:sawx=\“com.siebel.analytics.web/expression/v1\” xmlns:XMLSchema-instance “>xsi=\“http://www.w3.org/2001/XMLSchema-instance\” xsi:type=\“sawx:logical\” op=\“and\"><sawx:expr xmlns:sawx=\“com.siebel.analytics.web/expression/v1\” xsi:type=\“sawx:comparison\” xmlns:xsi=\“http://www.w3.org/2001/XMLSchema-instance\” op=\“equal\"><sawx:expr xmlns:sawx=\“com.siebel.analytics.web/expression/v1\” xsi:type=\“sawx:sqlExpression\” xmlns:xsi=\“http://www.w3.org/2001/XMLSchema-instance\">\“D4 Product\”.\“P01 Product\"</sawx:expr><sawx:expr xmlns:sawx=\“com.siebel.analytics.web/expression/v1\” xsi:type=\“sawx:untypedLiteral\” xmlns:xsi=\“http://www.w3.org/2001/XMLSchema-instance\">Product 04</sawx:expr></sawx:expr><sawx:expr xmlns:sawx=\“com.siebel.analytics.web/expression/v1\” xsi:type=\“sawx:comparison\” xmlns:xsi=\“http://www.w3.org/2001/XMLSchema-instance\” op=\“equal\"><sawx:expr xmlns:sawx=\“com.siebel.analytics.web/expression/v1\” xsi:type=\“sawx:sqlExpression\” xmlns:xsi=\“http://www.w3.org/2001/XMLSchema-instance\">\“D2 Market\”.\“M01 Market\"</sawx:expr><sawx:expr xmlns:sawx=\“com.siebel.analytics.web/expression/v1\” xsi:type=\“sawx:untypedLiteral\” xmlns:xsi=\“http://www.w3.org/2001/XMLSchema-instance\">Market 5</sawx:expr></sawx:expr></sawx:expr>”, ENDITEM,
Parameterised:
“Name=P0”, “Value=<sawx:expr xmlns:sawx=\“com.siebel.analytics.web/expression/v1\” xmlns:v1 “>xsi=\“http://www.w3.org/2001/XMLSchema-instance\” xsi:type=\“sawx:logical\” op=\“and\"><sawx:expr xmlns:sawx=\“com.siebel.analytics.web/expression/v1\” xsi:type=\“sawx:comparison\” xmlns:xsi=\“http://www.w3.org/2001/XMLSchema-instance\” op=\“equal\"><sawx:expr xmlns:sawx=\“com.siebel.analytics.web/expression/v1\” xsi:type=\“sawx:sqlExpression\” xmlns:xsi=\“http://www.w3.org/2001/XMLSchema-instance\">\“D4 Product\”.\“P01 Product\"</sawx:expr><sawx:expr xmlns:sawx=\“com.siebel.analytics.web/expression/v1\” xsi:type=\“sawx:untypedLiteral\” xmlns:xsi=\“http://www.w3.org/2001/XMLSchema-instance\">{Data_Product}</sawx:expr></sawx:expr><sawx:expr xmlns:sawx=\“com.siebel.analytics.web/expression/v1\” v1 “>xsi:type=\“sawx:comparison\” xmlns:xsi=\“http://www.w3.org/2001/XMLSchema-instance\” op=\“equal\"><sawx:expr xmlns:sawx=\“com.siebel.analytics.web/expression/v1\” xsi:type=\“sawx:sqlExpression\” xmlns:xsi=\“http://www.w3.org/2001/XMLSchema-instance\">\“D2 Market\”.\“M01 Market\"</sawx:expr><sawx:expr xmlns:sawx=\“com.siebel.analytics.web/expression/v1\” xsi:type=\“sawx:untypedLiteral\” xmlns:xsi=\“http://www.w3.org/2001/XMLSchema-instance\">{Data_Market}</sawx:expr></sawx:expr></sawx:expr>”, ENDITEM,
At this stage we can do something funky with the Parameters, discussed in the next section.
Parameters sourced from data 🔗
Up until now we’ve been dealing with dashboard and report names which are generally going to be fairly static and easy to derive. What about actual data though? We don’t want to have a load test based on one set of drill parameters, because what kind of test would that be. Nor do we want to have to sit and type out hundreds of permutations of data. Instead, let’s populate our parameter with real data.
This next bit assumes that you’ve got an ODBC system DSN set up to your BI Server that you’re load testing. Go and do that now if you haven’t.
In the Parameter List window (Ctrl-L) select the parameter, in this case Data_Market, and then click Data Wizard.  On the Database Query Wizard if you’re hard-core then you can click on “Specify SQL statement manually” but mere-mortals should leave the default “Create query using Microsoft Query”.
 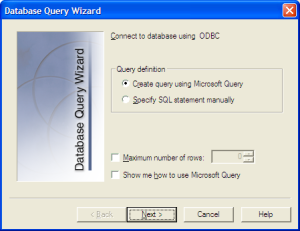 Chose your Data Source from the list - remember this is your BI Server ODBC connection, it is not your database. As a side-note, you could query the database directly, but you’d then have to work out which database table and column corresponded to the column in the Presentation Layer that you’re putting the predicate on. So you may as well just use the BI Server.
  Click OK and then specify your login credentials for the RPD.
  Check the Database corresponds to the Subject Area (you might get an error that it could not be accessed - I’ve ignored it so far without problem). Now pick the “Table” that your parameter is from, in this case Market is under “Other Dimensions”. Click Add and then Close.
 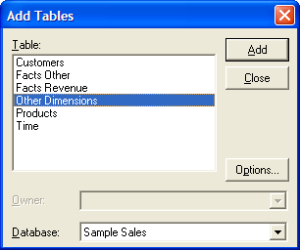 You should now have a Microsoft Query window with a table showing. Find the item in the table that corresponds to the parameter you’re populating, and double click it. It’ll be added to the lower pane and all its values shown.
  You can now click the exit icon (fourth from the left, a door with an arrow pointing left)
  or toolbar menu “File” -> “Exit and return to HP Virtual User Generator”. The data should be listed in the Parameter window list (and in the corresponding .dat file).
If you have data that is related then you could build a query here to populate a single .dat parameter file. In this example I’ve create a simple cartesian product just to demonstrate the concept, but if you had specific relationships such as Customers to Orders then this would be very relevant.  The multiple columns of data returned now populate a single .dat file, which you should name appropriately. If you’ve put Product as a separate parameter already then delete it, create it again and set it as a parameter type File with a File Path of the same .dat file as Market. Set the column number correctly so that it picks the data up. Note that BI Server’s Presentation Layer returns variable names with double quotes which disturbs the CSV format of the parameter .dat file and confuses LoadRunner’s dialog:
  After populating the file click “Edit with Notepad” and fix the column headings by changing this:
 ](http://rnm1978.files.wordpress.com/2009/09/lr41.png). LoadRunner doesn’t seem to like double quotations at all, so don’t use them. Close the Parameter List window and re-open it to get it to pick the file change up properly: [
 So now the variables are set up thus:
Data_Market Type: file File: data.dat Select column, by name: Market File format: Comma First data line: 2 Select next row: Random Update value on: Each occurance
Data_Product Type: file File: data.dat Select column, by name: Product File format: Comma First data line: 2 Select next row: Same line as Data_Market
NB If you’ve recreated any of your parameters by deleting and recreating them make sure the Parameter is still in your script, as LoadRunner will replace it with the original value when you delete the parameter.
Set “return 0;” as a breakpoint and update the run-time settings to run the new Drill action multiple time. Under run-time settings -> Log set Extended Log and tick Parameter Substitution so you can check the parms are working. Execute the VUser and check that you’re getting correctly parametrised drills.  Make sure that as well as seeing the parameters working you are actually getting the correct drill, by looking at the Run-Time Viewer (Tools -> General Options -> Display -> Show browser during replay). Compare the screen with that of when you manually navigate to the drill you’ve performed. The charts won’t display but assuming there’s some text content to the report it should show up correctly.
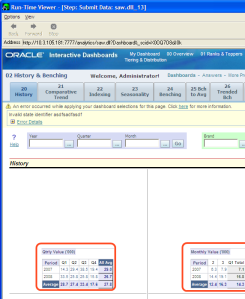
Be aware that you may get this message showing on your dashboard:  This is to do with session IDs and correlation, of which see below.
Think time 🔗
Once your basic script is ready you should add in some think times. Think time is a simulation of the user thinking (or staring gormlessly at the girl from HR ;-) ), and is important to a realistic performance test. In performance testing OBIEE we’re not trying to see how many MIPS we can thrash out of it, we’re trying to judge how the system would perform with certain volumes of user activity.
The syntax is : lr_think_time(30); where 30 in time in seconds. Don’t forget the trailing semi-colon.
I added a think time of five seconds prior to a report or drill click, and 30 seconds afterwards.
In the run-time settings think time can be altered or ignored. I’ve set it to use a random amount between 10% and 150% of that defined. 
Parametrising OBIEE usernames 🔗
It makes sense to parametrise logins so that you simulate many users (rather than many instances of one user). This will be in the vuser_init step. Change:
[sourcecode language=“bash”] […] ITEMDATA, “Name=NQUser”, “Value=Administrator”, ENDITEM, “Name=NQPassword”, “Value=Administrator”, ENDITEM, […] [/sourcecode]
to
[sourcecode language=“bash”] […] ITEMDATA, “Name=NQUser”, “Value={Username}”, ENDITEM, “Name=NQPassword”, “Value={Password}”, ENDITEM, […] [/sourcecode]
To add a set of many users to your repository you can use UDML. For more info on repository manipulation see here and here.
USING UDML IS NOT SUPPORTED BY ORACLE. USE AT YOUR OWN PERIL!!
-
Add a single test user to your repository, with a known password.
-
Use NQUdmlGen.exe to generate UDML of the repository [sourcecode language=“bash”]c:\OracleBI\server\Bin\nQUDMLGen.exe -U Administrator -P Administrator -R c:\OracleBI\server\Repository\samplesales.rpd -O c:\scratch\samplesales.udml.txt[/sourcecode]
-
Search the resulting UDML file for your new user, should look something like this: [sourcecode language=“xml”] DECLARE USER “PerfTestUser_01” AS “PerfTestUser_01” UPGRADE ID 2150312724 FULL NAME {Performance Testing user} PASSWORD ‘D7EDED84BC624A917F5B462A4DCA05CDCE256EEEEEDC97D5FF150B512EE8ED94985E8734986D5553C8F3BEE6EAF9FC34’ NEVER EXPIRES HAS ROLES ( “Administrators” ) NO STATISTICS DESCRIPTION {Pwd is y0rkshire} PRIVILEGES ( READ); [/sourcecode]
-
Strip all the line breaks so that it’s on a single line, and replace tabs with spaces
-
Put it in an Excel file so that the username’s repeated and the rest of the text static NB. If you replace “
” with \t” ”\t (where \t is tab character) then when you paste it into Excel it’ll sort the columning out automatically.  Copy the resulting UDML to a new file, eg. newusers.udml.txt
 -
Use nQUDMLExec.exe to merge in the new users. Make sure you work on a backup copy of the repository. Whilst you can specify to overwrite the existing RPD, it is prudent to write to a new one and then rename it once you’ve verified it’s all ok. [sourcecode language=“bash”] c:\OracleBI\server\Bin\nQUDMLExec.exe -u Administrator -P Administrator -I c:\scratch\newusers.udml.txt -B c:\OracleBI\server\Repository\samplesales.rpd -O c:\OracleBI\server\Repository\samplesales.new.rpd [/sourcecode]
You should get the nicely optimistic “Complete success!!!” message :)
-
Open your new repository (in this example samplesales.new.rpd) in the Administration Tool and admire your shiny new users:
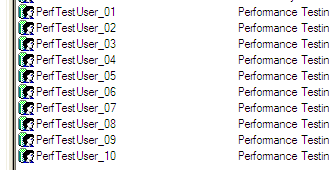
-
Using the same Excel sheet, create a CSV file for use as a Parameter data file:
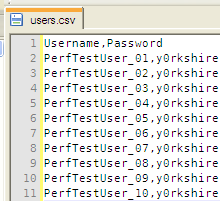
-
In Load Runner, define two new Parameters with type File and using the csv file you’ve just created as the source:
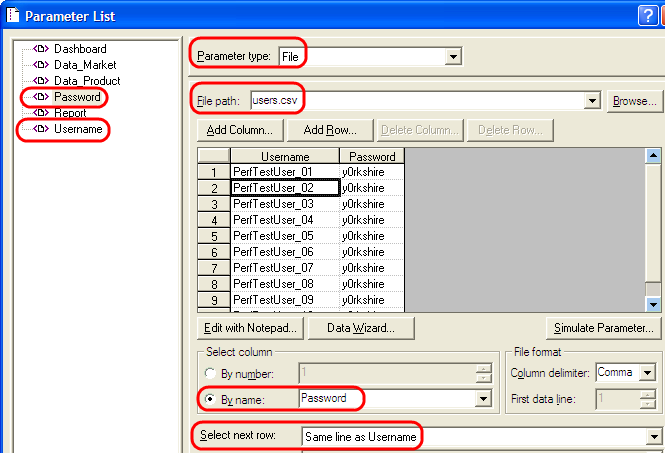
And finally … 🔗
You should now have the basics of a valid VUser script to run through the load generator and get some numbers. Bear in mind this article is aimed at getting OBIEE and LoadRunner working together. It does not touch on other crucial aspects of load testing such as:
- Designing test scenarios
- Designing and validating repeatable performance tests
- Monitoring, capturing and analysing the database during the test
- Monitoring, capturing and analysing the application host server’s vital stats (CPU, disk, memory, etc) during the test
All of these are topics in their own right, and to get any value out of performance testing need to be researched and done properly. Otherwise you end up with geeee ain’t this cool, I can run a thousand users at once! oh, what now …. which is not very scientific and not much use to anyone.
See this supplemental blog post for various notes that I made during this but which aren’t directly part of the step-by-step tutorial.

![LR01 Create a new VUser of Protocol type Web (HTTP/HTML) [File -> New… -> New Single Protocol Script -> Web (HTTP/HTML)]](http://rnm1978.files.wordpress.com/2009/09/lr01.png?w=300)
