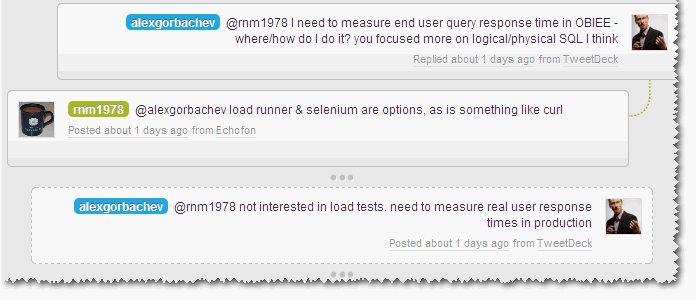
@alexgorbachev tweeted me recently after picking up my presentation on Performance Testing and OBIEE. 
His question got me thinking, and as ever the answer “It Depends” is appropriate here :-)
Why is the measurement being done? 🔗
Without knowing the context of the work Alex is doing, how to measure depends on whether the measurement needs to be of: -
- The actual response times that the users are getting, or
- The response times that the system is currently capable of delivering
This may sound like splitting hairs or beard-scratching irrelevance, but it’s not. If the aim of the exercise is to be able to make a statement along the lines of:
On Monday morning between 09:00 and 10:00 we saw system response times of x seconds
then we can consider simulating a user and recording response times this way. After all, what difference does it make whether it’s Jim, Jemima or Jeremy using the system, or a simulated web client? They’re all sending an HTTP request to the same web server, hitting the same presentation services, BI server, and database. If on the other hand we want to say something like:
On Monday morning between 09:00 and 10:00 response times experienced by the end user were x seconds
then we need to audit and trace user activity through some means. We can’t use a simulated user session, because it would only ever be that - simulated. If a user says that the system performance is awful then you need to be able to quantify and diagnose that, and the best way is through their eyes. A simulated user is only ever going to be a best-guess of user activity, or even if it’s a replay of past behaviour it may not be the same as they’re doing currently.
These considerations also feed into the point at which we take the measurements. There is no out of the box tracking of response times at the end-user, but there is out of the box tracking of response times at the BI Server. If you are happy to settle for the latter then you save yourself a lot of work. If your requirement is to give an extremely accurate figure for the response time at the end-user then Usage Tracking data from the BI Server is irrelevant (because it doesn’t account for time spent in Presentation Services). However, if you know anecdotally that your reports aren’t that complex and generally time in Presentation Services is minimal then you should consider Usage Tracking, unless the precision required for response time is so great. Consider which is better - to spend an hour configuring Usage Tracking and get response times accurate to within a few seconds (assuming that Presentation Services time is either minimal or consistent so can be factored in), or spend x days or weeks trying to hack together a way or measuring times at the end user – is the extra accuracy definitely necessary? See slides 11-13 of my presentation for more discussion around this and defining the scope of a test and measurement taking.
So, these thoughts aside, what are the options for examining response times at the end-user point of OBIEE?
Actual response times as experienced by users 🔗
As discussed above, Usage Tracking data will get you the response times at the BI server, but doesn’t include anything upstream of that (Presentation Services, App/Web server, network, client rendering). The options that I can think of for recording timings at the end user are:
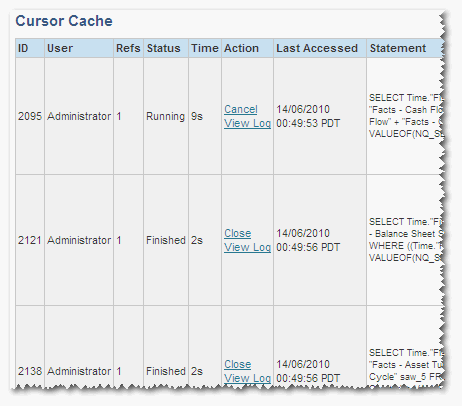
- Presentation Services Session Monitor - This is a point-in-time record in Presentation Services of each request that is served. It logs the Logical SQL, request type and source, user, records returned, and response time. For a single dashboard there may be many entries. It’s entirely transient so far as I know, so is only useful for observing a session as it happens. It would be nice if there were a web services interface to this but it doesn’t look like there is. You can access it directly at http://[server]:[port]/analytics/saw.dll?Sessions

- Log mining - sawserver - The presentation services log file, sawserver.log, can be configured to record detail down to a very low level, certainly enough to be able to track user requests and responses. However unless you’re looking at diagnosing a problem for a specific user then this method is probably unrealistic because such levels of logging on a production server would be unwise.
- Client side logging - some kind of hack to monitor and record the user’s experience. Something like FireBug or Fiddler2 in logging mode? Not very viable unless it’s low number of users and you have access to their web browser & machine.
Bear in mind that options 1 and 2 only give the response time as far as Presentation Services; they do not include network and rendering at the client. In some cases these times can be considerable (particularly if you have badly designed reports).
Response times of the system 🔗
If you’re just trying to measure response times of requests sent to Presentation Services there are several possibilities. As above it depends on the aim of your testing as to which approach you choose:
- Simulate user client activity - Use a web client testing tool (eg. Load runner, OATS, Selenium) to record and replay user actions in Answers/Dashboards as if through a web browser, and capture the timings. NB just because Load Runner is best known for Load testing, there’s no reason it can’t be used for replaying individual users to measure standard response times rather than under load. I think (although haven’t tried) HP’s BAC can also replay LoadRunner VUser scripts and capture & monitor timings over time, alerting for deviances.
- Go URL - Documented in Chapter 11 of the Presentation Services Admin Guide (and Nico has a nice summary and set of examples here), this is a way of issuing direct requests to Presentation Services by building up the request in the URL. Using this method you could then wrap a simple wget / curl script around it and build up a set of timings that way.
curl -o c:\scratch\tmp.html "http://[server]:[port]/analytics/saw.dll?Dashboard&PortalPath=%2Fshared%2FFinancials%2F_portal%2FPayables&Page=Overview&NQUser=User&NQPassword=Password"
Bear in mind that Answers/Dashboards are asynchronous so the first server response may not equate to a fully-loaded dashboard (you may get “Searching … " first, and then the chart/table is delivered & rendered). See some of the discussion on my earlier postings around Load Runner, particularly this one. 3. Web services - documented here, this would be similar to Go URL, in that it’s a way of requesting content from Presentation Services in a way that can be scripted and thus timed - but again is not necessarily reproducing the full user experience so make sure you’re aware of what you are and are not actually testing.
Can anyone suggest other options?
