I’ve been involved with some performance work around an ODI DWH load batch. The batch comprises well over 1000 tasks in ODI, and whilst the Operator console is not a bad interface, it’s not very easy to spot the areas consuming the most runtime.
Here’s a set of SQL statements to run against the ODI work repository tables to help you methodically find the steps of most interest for tuning efforts.
odi_04.sql – Session runtimes, including child sessions 🔗
First off is the most fancy - using hierarchical SQL, it returns all sessions and child sessions: [sourcecode language=“sql”] – odi_04.sql – – ODI sessions and child sessions - runtimes – – http://rnm1978.wordpress.com/ –
select –level, –, parent_sess_no sess_no, –Following column can be included if you want to see the root parent session name –CONNECT_BY_ROOT sess_name “Root session”, – – Remove the lpad if you don’t want child sessions indented in the results lpad(’> ‘,3*(level-1),’-’) || sess_name “Name”, TO_CHAR(SESS_BEG,‘yyyy-mm-dd hh24:mi:ss’) as “Session Start”, TO_CHAR(SESS_END,‘yyyy-mm-dd hh24:mi:ss’) as “Session End”, SESS_DUR, SESS_STATUS from SNP_SESSION – You can determine how many levels to navigate: level 1 is the master sessions and no children, level 2 is the first layer of children, etc. –where level <= 3 start with parent_sess_no is null – Use a mixture of the following predicates to identify your batch within the ODI Work Repository, and/or part of the batch of interest – and sess_name like ‘%LOAD%’ – and sess_status = ‘D’ and sess_beg between to_date(‘1/11/2010 09:00’,‘DD/MM/YYYY HH24:MI’) and to_date(‘4/11/2010 18:00’,‘DD/MM/YYYY HH24:MI’) connect by prior sess_no = parent_sess_no / [/sourcecode]
This would return something similar to this: 
It’s worth noting a couple of things:
- “D” status means “Done”. There’s a table in the ODI repository that decodes statuses, although they’re normally obvious
- Seconds is the total for the session, including child sessions. So in the example shown, “LOAD_FACT1_TRANS_BATCH” takes a total of 4510 seconds, which is comprised of tasks within the session (see below), plus the runtime of LOAD_FACT1_STUFF (64 seconds) and LOAD_FACT1_SALES (4443 seconds).
From this example, there are plenty of long-running steps, so let’s pick one I prepared earlier, session number 984170, “LOAD_FACT1_SALES”, which is a child session of “LOAD_FACT1_TRANS_BATCH” (session number 980170).
odi_06.sql – Session runtime, broken down by step 🔗
Using the session number determined by our analysis of the overall batch session runtimes, here’s a query to show the runtime for each step in the session. It is possible to combine this with the hierarchical SQL of above, but I personally found it resulted in too much data to sift though as well as increasing the chances of random stabbing at big numbers. By picking a session from the first query for deliberate further analysis the mind is focussed on it.
[sourcecode language=“sql”] – odi_06.sql – – ODI session broken down by step, for a single session – – http://rnm1978.wordpress.com/ – select s.sess_no “Session #”, sl.nno as “Step Number”, sess_name “Session Name”, ss.step_name “Step Name”, to_char(sl.step_beg,‘yyyy-mm-dd hh24:mi:ss’) “Step Start”, to_char(sl.step_end,‘yyyy-mm-dd hh24:mi:ss’) “Step End”, sl.step_dur “Step Dur (s)”, from SNP_SESSION S left outer join snp_sess_step ss on s.sess_no = ss.sess_no inner join SNP_STEP_LOG SL on ss.sess_no = sl.sess_no and ss.nno = sl.nno where s.sess_no = 984170 ; [/sourcecode]
For our example session it would give us output something like this:

So now we can see that of a long-running load step, over 80% of the time is spent on the step “Int. Table2 Merge”, step number 3
odi_07.sql – Session runtime, broken down task, for a given step 🔗
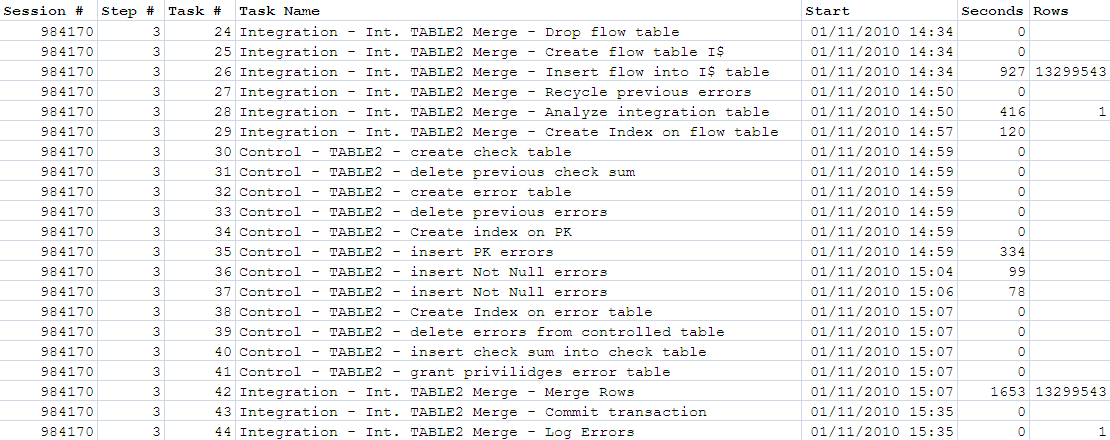
Using the same session number as before, and step number 3 as identified above, let’s have a look at the individual tasks: [sourcecode language=“sql”] – odi_07.sql – – ODI session broken down by task, for a given session and step – – http://rnm1978.wordpress.com/ – select s.sess_no as “Session #”, sl.nno as “Step #”, st.scen_task_no as “Task #”, st.task_name1 || ’ - ’ || st.task_name2 || ’ - ’ || st.task_name3 “Task”, to_char(stl.task_beg,‘yyyy-mm-dd hh24:mi:ss’) “Task Start”, stl.task_dur, stl.nb_row from SNP_SESSION S left outer join snp_sess_step ss on s.sess_no = ss.sess_no inner join SNP_STEP_LOG SL on ss.sess_no = sl.sess_no and ss.nno = sl.nno inner join SNP_SESS_TASK ST on SS.sess_no = st.sess_no and ss.nno = st.nno inner join SNP_SESS_TASK_LOG STL ON SL.SESS_NO = STL.SESS_NO and SL.nno = STL.nno and SL.nb_run = STL.nb_run and st.scen_task_no = stl.scen_task_no where s.sess_no = 984170 and sl.nno = 3 ; [/sourcecode]

So from here I’d be focussing on two things:
- Of the long-running tasks, can they be tuned?
- Is this whole step using the most efficient logic? Could some of the tasks be combined or removed entirely? Could the load be done in a better way?
More funky stuff 🔗
odi_08.sql - Identify task optimisation candidates 🔗
At first glance this is a quick-win for listing out the longest running tasks within a batch. And it is that. But, beware of taking a blinkered view of tasks in isolation. The advantage of using the queries above to drill down from overall batch runtime down through sessions, steps, and then to tasks, is that you have the context of the task. Still, this query that follows can be useful for a quick hit list of tasks to check that have been covered off by more detailed analysis. [sourcecode language=“sql”] – odi_08.sql – – ODI task optimisation candidates – – http://rnm1978.wordpress.com/ –
select DISTINCT –level st.task_name1 || ’ - ’ || st.task_name2 || ’ - ’ || st.task_name3 “Task”, stl.task_dur, stl.nb_row, s.sess_no || ‘/’ || sl.nno || ‘/’ || stl.scen_task_no as “Session/Step/Task #”, SYS_CONNECT_BY_PATH(s.sess_name, ’ / ‘) || ’ / ’ || ss.step_name “Step Name” from SNP_SESSION S left outer join snp_sess_step ss on s.sess_no = ss.sess_no inner join SNP_STEP_LOG SL on ss.sess_no = sl.sess_no and ss.nno = sl.nno inner join SNP_SESS_TASK ST on SS.sess_no = st.sess_no and ss.nno = st.nno inner join SNP_SESS_TASK_LOG STL ON SL.SESS_NO = STL.SESS_NO and SL.nno = STL.nno and SL.nb_run = STL.nb_run and st.scen_task_no = stl.scen_task_no where stl.task_dur > &&min_duration_secs and st.task_name3 != ‘Run_Subscribed_Process_ID’ – Ignore parent tasks of child sessions start with parent_sess_no is null and sess_beg between to_date(‘1/11/2010 09:00’,‘DD/MM/YYYY HH24:MI’) and to_date(‘1/11/2010 18:00’,‘DD/MM/YYYY HH24:MI’) connect by prior s.sess_no = s.parent_sess_no order by stl.task_dur desc / [/sourcecode]

As can be seen clearly from this, there are several different types of task within ODI and not all with have a row count associated with them.
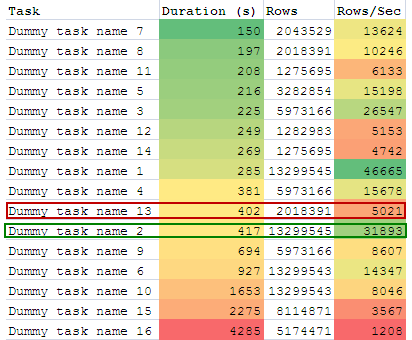
We can start doing more advanced analysis using this data. For example, of the tasks that do return row counts, what rows/sec throughput are we getting? Are there any steps where the throughput is abnormally low, and therefore a candidate for further examination? Dumping the output of odi_08.sql into Excel and adding a derived column rows/sec, and applying Colour Scales Conditional Formatting gives this: 
Looking at this and picking out two tasks that ran for about seven minutes, I’d be a lot more interested in “dummy task 13” which processed just over 2 million rows in that time, compared to “dummy task 2” which processed nearly seven times as many - 13 million. Now it may be one is doing a direct insert and the other’s doing some complicated merge logic, but it’s well worth checking before just heading for the biggest runtime numbers.

