Introduction 🔗
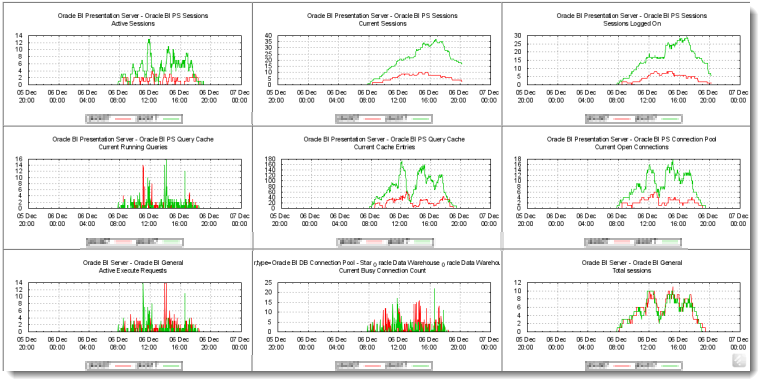
This is the third part of three detailed articles making up a mini-series about OBIEE monitoring. It demonstrates how to capture OBIEE performance information, and optionally graph it out and serve it through an auto-updating webpage.
This final article describes how to bolt on to OAS a simple web page hosting the graphs that you created in part 2, plotting data from OBIEE collected in part 1.
The webpage 🔗
This is just an old-school basic HTML page, with a meta-refresh tag (which note that Chrome doesn’t work with) and img tags:
<html> <meta http-equiv="refresh" content="60"> <head> <title>OBIEE Servers</title> </head> <body> <img src="server01.png"></br> <img src="server02.png"></br> </body> </html>
I shan’t patronise you nor embarrass myself with my rusty HTML skills any further - I’ll leave you how to build your dashboard how you want it.
OAS 🔗
This is hack! I am not an expert at Apache, so please don’t take my word for it that this is the best way to do it. It worked for me, but mightn’t for you.
If you’ve got OAS installed for your OBIEE installation, you can tweak it to serve up your new graphs too. If you’re using OC4J, IIS, or another webserver, then you’ll have to figure this bit out yourself.
Assuming that your OBIEE JMX graphs and HTML files are in /tmp/obieejmx, make sure that they’re readable by all: [sourcecode language=“bash”] chmod -R o+rx /tmp/obieejmx [/sourcecode]
Now go to your OAS folder, navigate to Apache/Apache/conf, and MAKE A BACKUP of httpd.conf [sourcecode language=“bash”] cd /your/path/to/OAS/here cd Apache/Apache/conf cp httpd.conf httpd.conf.bak [/sourcecode]
Open httpd.conf in vi (or if you’re not a real man then FTP the file to Windows and open it in Notepad ;-) )
- Search for [sourcecode]<IfModule mod_alias.c>[/sourcecode]
- Add the following beneath it:[sourcecode] Alias /obieejmx/ “/tmp/obieejmx/” <Directory “/obieejmx/"> AllowOverride None Options None Order allow,deny Allow from all [/sourcecode]
- Here’s where you’d change the location of your graphs and HTML file if you needed to
- Save httpd.conf
- Restart Apache[sourcecode]opmnctl restartproc ias-component=HTTP_Server[/sourcecode] or if that doesn’t work restart OAS[sourcecode]opmnctl shutdown opmnctl startall[/sourcecode]
Assuming you normally access OBIEE through http://myserver:7777/analytics/ then you should now be able to go to http://myserver:7777/obieejmx/ and view the fruits of your hard-earned work. 
What next 🔗
Obviously, the gnuplot/OAS hack is a bit crude, but for me was the quickest way to get “to market” the power of the OBIEE systems management metric collection by jmx that is possible for anyone with some basic *nix skills and some time to put it together.
The BI Management Pack for Enterprise Manager probably provides some if not all of this functionality but isn’t always available to use (and also has licensing implications).
Whether you collect metrics for day-to-day monitoring of OBIEE, capacity planning, or investigative work, I’ve hopefully demonstrated how easy it is to work with once you’ve got the basics mastered. And the beauty of doing it with shell scripts is that you can customise it to your heart’s content.
There’s a whole bunch of analysis that I’d like to do now, around things like our registered user count vs logged on users vs active users (to determine what actually is our concurrent user rate), as well as profiling BI Server load against database load.
It would also be fun to develop the HTML just a little bit further to create a mock drill-down on the graphs, although if you’re anything like me be aware of “just tweaking for a minute” turning into far too long given then throwaway nature of the solution.
Finally, bear in mind this is now dated technology - some of it may be on the junk heap for OBI11g.
