Those of you who read my blog regularly may have noticed I have a slight obsession with the OBIEE systems management capability which is exposed through JMX. Venkat has blogged this week about JMX in OBI11g, and it’s clearly a technology worth understanding properly. I’ve recently been tinkering with how to make use of it for monitoring purposes, most recently using JConsole and discussed here. What follows is an extension of this idea, cobbled together with a bit of shell scripting, awk, gnuplot, and sticky backed plastic. It’s built on OBIEE 10g - for OBI11g it may differ (although I understand that Performance MBeans still exist).
Whether you collect metrics for day-to-day monitoring of OBIEE, capacity planning, or investigative work, it’s valuable data (in my humble opinion) that will help you understand the usage of the application by the users that you support.
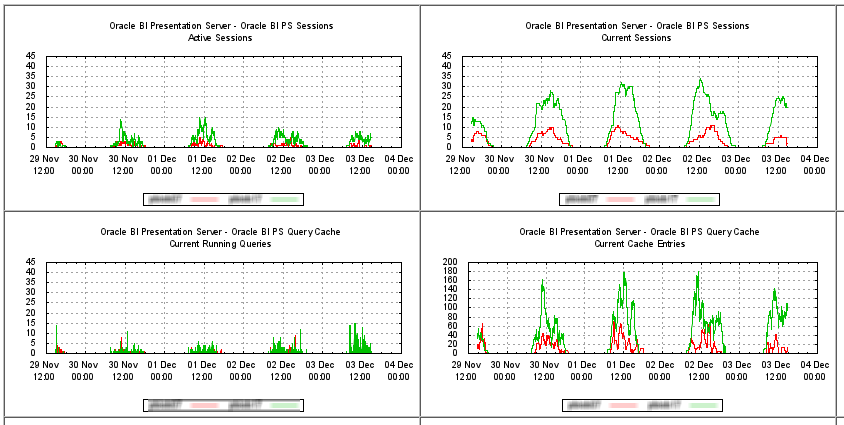
To whet your appetite, here’s a sample of what you can produce, in realtime:


Before you start this, I recommend reading how to secure your jmx agent if you’re working with production systems.
Overview 🔗
There are three parts to my monitoring application, and you can pretty much pick and mix as you want. Obviously without any data collected then graphing it will be pretty dull, but you may opt to collect the data and then work with it another way (Excel, OBIEE, etc). I’ve broken the details down into three separate blog posts:
- Metric collection from a remote BI Server, using jmxsh
- Graph rendering of the collected data, using gnuplot
- Web page serving of the rendered graphs, bolted onto the OAS already in place for Presentation Services.
