Over the last few months I’ve been doing a lot of exploring of OBIEE Systems Management data, covered in a mini-series of blog posts, Collecting OBIEE systems management data.
There are a vast number of counters exposed, ranging from the very interesting (Active Sessions, Cache Hits, etc) to the less so (Total Query Piggybacks, although for some seriously hardcore performance tuning even this may be of interest).
This short blog post is about a couple of counters which I’ve been monitoring but which looks to not be entirely reliable. Both are in the Oracle BI DB Connection Pool, and are:
- Current Connection Count - The current number of open connections in the thread pool.
- Current Busy Connection Count - The current number of connections assigned to process a query or processing a query in the DB Connection pool.
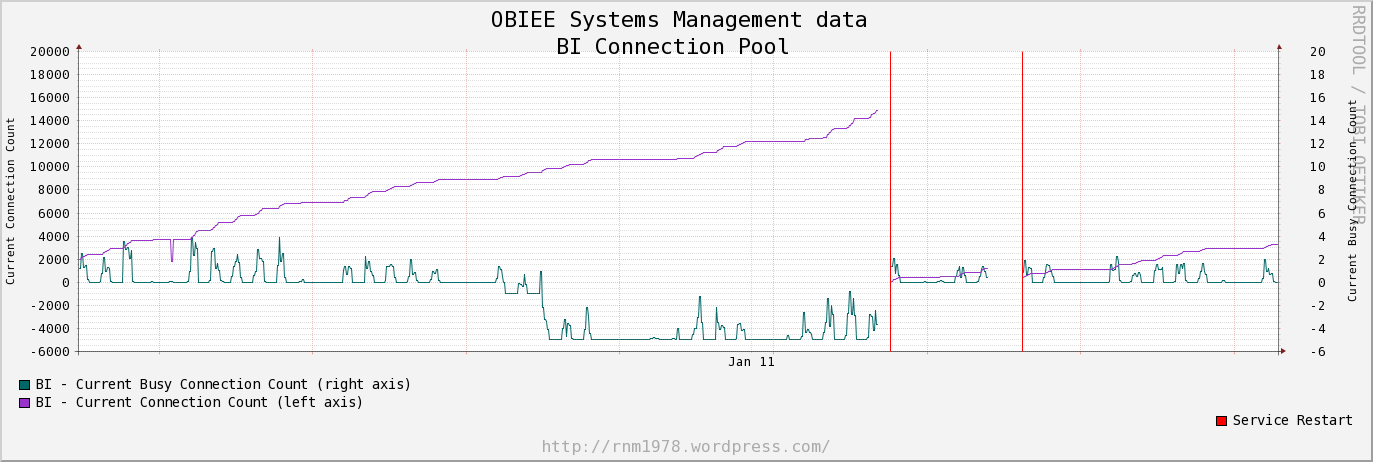
A picture tells a thousand words in this case: 
We can clearly see :
- Current Busy Connection Count ("The current number of connections assigned to process a query or processing a query in the DB Connection pool.") goes negative!
- Current Connection Count ("The current number of open connections in the thread pool.") accumulates. Either the counter is buggy, or there really are thousands of open connections in the thread pool which sounds worrying in itself.
These two counters reset and correct themselves only on a BI Server restart, which can be seen by the red vertical lines on the graph.
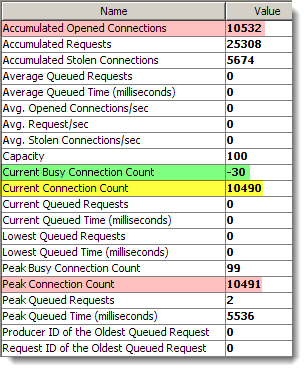
A snapshot of the current figures (via JConsole) backs up these numbers and puts “Current Connection Count” in context next to the ‘Peak’ and ‘Accumulated’ figures: 
