Just because something produces the correct numbers on the report, it doesn’t mean you can stop there.
How you are producing those numbers matters, and matters a lot if you have an interest in the long-term health of your system and its ability to scale.
OBIEE is the case in point here, but the principle applies to any architecture with >1 tiers or components.
Let me start with a rhetorical question. The user has got a report which has ten rows of data. Which of the following methods is going to be a more efficient way to generate the report?
- Transfer the ten rows of data from the database back to the rendering application, and the rendered report to the user
- Transfer fourteen million rows of data from the database back to the rendering application, get the application to crunch these to the required ten rows, transfer rendered report to the user
Obviously, it’s the first one. In the second one (and this is no hyperbolic example to prove a point, I’m sorry to say) we have the following overheads:
- Network traffic of fourteen million rows from the database to the application server
- Disk and/or Memory impact on the application server, depending on how it’s processing those fourteen millions rows
- CPU impact on the application server when it processes those fourteen million rows
Considering OBIEE specifically, you should be aiming to be able to answer all of your questions on the database directly. As soon as you start using the database simply as a source for dumping big volumes of rows into your OBIEE server, you’re storing up problems. An RDBMS is designed for crunching lots of data. You’ve already lifted all that data off the disk when you selected it out of the tables on Oracle DB - why not get Oracle DB to do the additional processing required too? Where’s the benefit in lifting & shifting all of that data to then reprocess it again? In fact, consider why you’re crunching big volumes of data each time in the first place. If multiple people have the same big queries, are you missing some aggregates in your data source that would support these queries much better? Or do you need to be looking towards multi-dimensional sources such as Oracle OLAP or Essbase?
The flexibility and power of OBIEE to do its own calculations and aggregations on data is a double-edged sword, and one to be wielded with responsibility. It is a great feature and one which cannot be avoided if you’re using federated queries across disparate sources. But if you’re using it out of ignorance or laziness to brute-force a solution instead of doing the big work at the lowest level possible then you’re asking for trouble.
If you rely on OBIEE to do the heavy work of your reporting solution, then you need to factor this in to your hardware spec for the machine. As a reporting interface to well aggregated data with fairly simple reports, we’ve found that it runs at minimal CPU, and doesn’t stress the disk. You can predict fairly reliably that this should scale just fine so long as your database can. But if you put the workload on the OBIEE server too, you’re going to hit bottlenecks much sooner.
The principle of moving as little data around as possible is described by Cary Millsap as “Filter Early” and described well in his blog article. Thanks to @RonCrisco for helping me remember the name. @cdturri pointed out that it’s also just common sense :-). Applying it to a specific system, Exadata uses it in its SmartScan technology where it applies filtering of data directly on the storage rather than bringing all the data back up to the database SQL processing layer (h/t @ocpdba).
Case-study 🔗
Here’s an example of a situation where all is not well in OBIEE-land.
We were alerted to it by unix complaining that a filesystem was running low on space. Checking the contents of the filesystem we spotted these monsters:
[user@server]/data/bi/tmp $ls -lrt
total 112914646
[...]
-rw-------   1 user   biadmin    29122976800 Apr  6 11:32 nQS_20117_465_33898735.TMP
-rw-------   1 user   biadmin    24816966976 Apr  6 11:12 nQS_20117_464_33792457.TMP
-rw-------   1 user   biadmin    3582054936 Apr  6 11:46 nQS_20117_469_37979712.TMP
[...]
These are temporary files generated by BI Server (nqsserver), and for those of you viewing in black and white, those files are getting on for 30GB a go!
When queried, NQQuery.log embarrassingly admits facts such as:
Rows 13,894,550, bytes 3,260,497,648 retrieved from database query id: xxxx
and Usage Tracking shows the kind of damage being inflicted:
Total
                       time     row num db     cum num
START_TS     END_TS     sec   count  query      db row

06-APR 10:05 10:18      579       0      6   3,436,816
06-APR 10:05 10:18      553       0      4   3,239,101
06-APR 10:05 10:18      383       0      3   1,624,656
06-APR 10:11 11:48     5694       0      1  13,894,550
06-APR 10:11 11:48     4314       0      1  11,840,156
06-APR 10:21 10:27      336     456      4   3,239,101
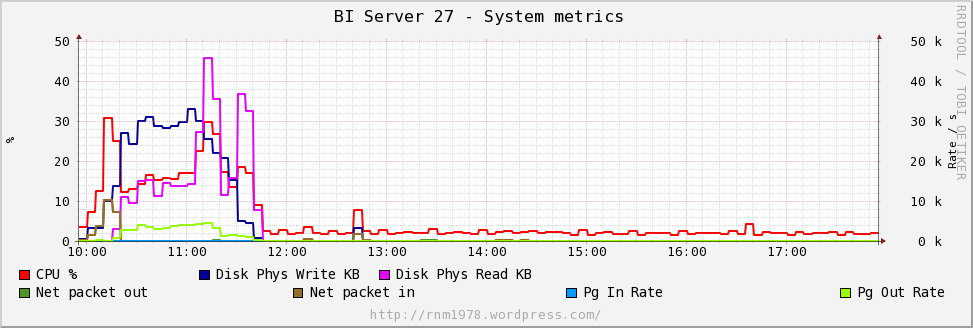
A look at the machine’s vital statistics for this time period shows the impact: 
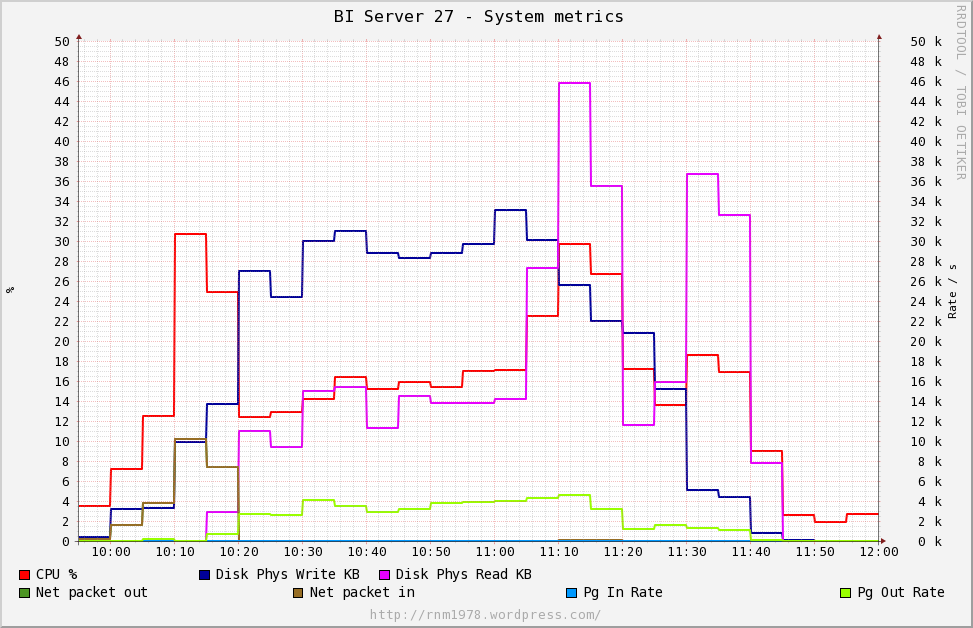
For a bit more detail, here’s the time period at greater resolution: 
Notice that the server starts paging out during the work, and there’s a lot of disk activity - both read and write. CPU goes from a normal c.5% up to 20-30%.
This was one user doing this – care to place bets on how the system would perform if it were rolled out to ten users running this kind of workload?
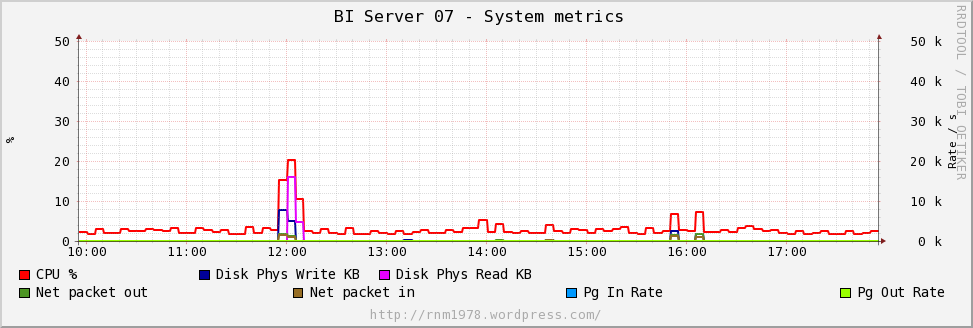
For reference, here’s one of our other BI Servers which serves at least 10 times as many users, where the reports do the bulk of their work in the database: 
Monitoring for problems 🔗
There are a few easy ways to look out for this bad behaviour. The first is in Usage Tracking, where you can look at S_NQ_ACCT.CUM_NUM_DB_ROW and compare it to S_NQ_ACCT.ROW_COUNT, even writing an alert for when this ratio goes above a defined threshold. You could also look at an alert on S_NQ_ACCT.CUM_NUM_DB_ROW going above a fixed number, since depending on your system’s purpose and architectural principles you might want to aim to never be pulling back more rows from the database than necessary for a report.
I’d also pay close attention to S_NQ_ACCT.NUM_DB_QUERY, as this will show you reports generating more than one query on the database and thus increasing the workload on the BI Server processing the combined results.
Another thing to check is the NQQuery.log, looking at the number of bytes returned from a database query. This could feed into some kind of generated alert for closer investigation if a query returns above a certain number. OBI 10g:
grep retrieved NQQuery.log|awk '{print $5}'|sort -n
OBI 11g:
grep retrieved NQQuery.log|awk '{print $20}'|sort -n
(if you’re running on Windows then to run this command you’ll need either cygwin or google for a Win32 version of grep/awk/sort - or brew your own Powershell version)
I’d also strongly recommend monitoring your BI Server’s TEMP folder (defined as WORK_DIRECTORY_PATHS in NQSConfig.INI), as this is where it lands the data to disk when it’s got to crunch it. Monitor this for two reasons - to spot when bad stuff’s happening, but also in case it fills up and causes your BI Server to barf. For the latter, you can expect to get:
[nQSError: 10058] A general error has occurred.
[nQSError: 46118] Out of disk space.
Developing for the long term 🔗
How do you assess your development projects for quality? You presumably are keen that the reports match the specifications and return the right numbers. You hopefully also have NFRs for how quickly these reports run. But what about system impact of new developments? How do you quantify this?
Unless you are delivering a standalone project, fire-and-forget, then maybe you can performance test for load and concurrency up-front to validate how well your solution will scale to the required users. But lots of BI projects are iterative and may well be across functions too. Just because your development project is first to land it doesn’t give you the right to dump a steaming pile on the servers and proclaim that it works with your user volumes and meets their NFRs, so all is well. What about all the projects that come along next, and are going to be hindered by your mess?
This is where another double-edged sword comes into play - “Best Practice”. For me, Best Practice is a way of doing something that multiple implementations, time and expertise has shown to be the best way of not screwing up. It is the starting point from which to work, understanding deviations as required. What it is not, and what gets it the bad reputation, is a fixed set of crude rules to be adhered to blindly and implemented without questioning or understanding.
If a system is not adhering to the kind of best practice I’m talking about here - filter early, in essence - then there may be a good reason. But that reason must be consciously and loudly acknowledged and documented.
