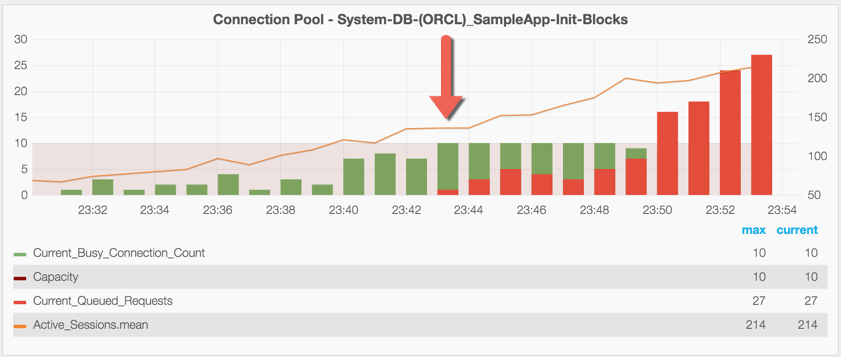
It struck me today when I was writing my most recent blog over at Rittman Mead that I’ve been playing with visualising OBIEE metrics for years now.
-
Back in 2009 I wrote about using something called JManage to pull metrics out of OBIEE 10g via JMX:

-
Still with OBIEE 10g in 2011, I was using rrdtool and some horrible-looking tcl hacking to get the metrics out through jmx :

-
2014 brought with it DMS and my first forays with Graphite for storing & visualising data:

-
My current weapon of choice is OBIEE DMS metrics -> obi-metrics-agent -> InfluxDB -> Grafana

Why’s this interesting? I guess just that the numbers have always been there for the taking & use, but nowadays it is so easy to store them and interactively analyse them there is no excuse not to be doing so!
