InfluxDB is a great time series database, that’s recently been rebranded as part of the “TICK” stack, including data collectors, visualisation, and ETL/Alerting. I’ve yet to really look at the other components, but InfluxDB alone works just great with my favourite visualisation/analysis tool for time series metrics, Grafana.
Getting data into InfluxDB is easy, with many tools supporting the native InfluxDB line input protocol, and those that don’t often supporting the carbon protocol (from Graphite), which InfluxDB also supports (along with others). So for collecting broad ranges of OS stats, for example, collectl via carbon and nmon via nmon2influxdb are both viable options.
Using the power of *nix, we can set up a hacky, but effective, way of streaming additional data into InfluxDB. For example, tracking the the amount of disk space used by a set of particular folders on disk can be really useful as part of system monitoring & troubleshooting. We can get the raw information easily enough at the commandline:
[oracle@demo ~]$ du -s /app/oracle/biee/user_projects/domains/bi/servers/*/tmp
417764	/app/oracle/biee/user_projects/domains/bi/servers/AdminServer/tmp
2061740	/app/oracle/biee/user_projects/domains/bi/servers/bi_server1/tmp
8	/app/oracle/biee/user_projects/domains/bi/servers/obiccs1/tmp
277484	/app/oracle/biee/user_projects/domains/bi/servers/obips1/tmp
636	/app/oracle/biee/user_projects/domains/bi/servers/obis1/tmp
12	/app/oracle/biee/user_projects/domains/bi/servers/obisch1/tmp
By using tools like sed and awk to reformat the data and construct the InfluxDB input message, and then send it over using curl:
while [ 1 -eq 1 ]; do
du -s /app/oracle/biee/user_projects/domains/bi/servers/*/tmp| \
sed 's/\/app\/oracle\/biee\/user_projects\/domains\/bi\/servers\///g'| \
sed 's/\/tmp//g'| \
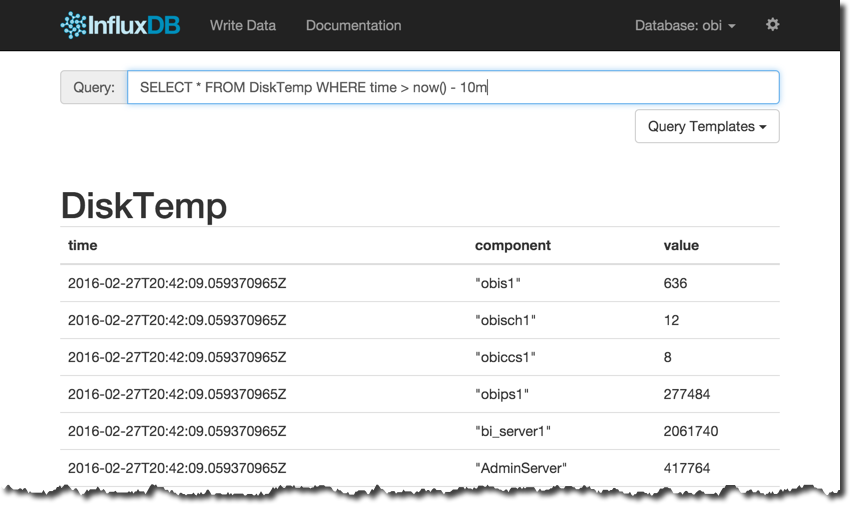
awk '{print "DiskTemp,component="$2" value="$1}'| \
curl -i -XPOST 'http://localhost:8086/write?db=obi' --data-binary @-
sleep 10
done
Note the \ line continuation characters - the du pipes to sed (twice), then to awk and finally to curl.
Heading over to InfluxDB’s admin interface we can see the data’s been received:
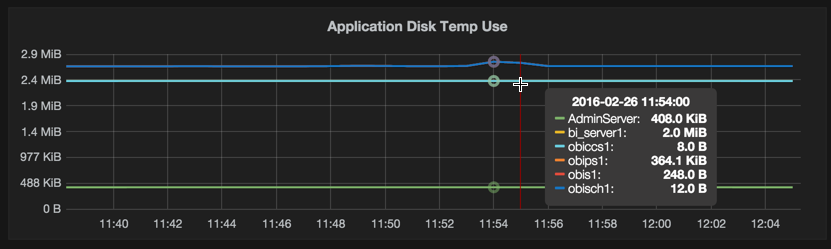
And from there on into displaying it in Grafana:
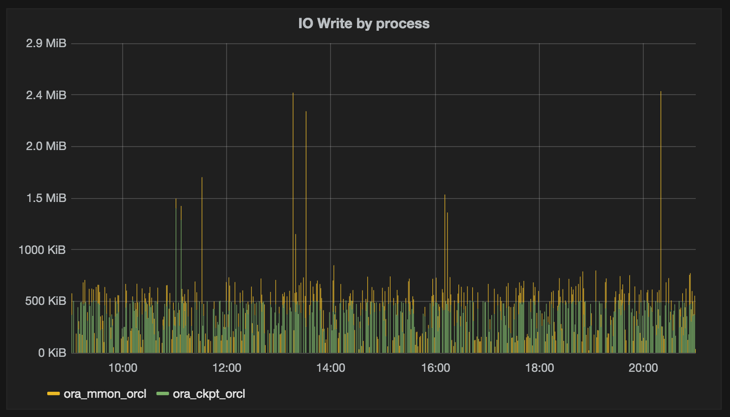
Similarly, for collecting iotop data, this time as a one-liner:
while [ 1 -eq 1 ]; do sudo iotop -n 1 -k -qqq -o|awk '{print "io_read_kbs,pid="$1",process="$12" value="$4"\nio_write_kbs,pid="$1",process="$12" value="$6}'|curl -i -XPOST 'http://localhost:8086/write?db=io' --data-binary @-;sleep 1;done

Even if proper metrics collection tools like collectl can get this information, for point-in-time digging without needing to reconfigure and restart services, this is a handy trick to have up one’s sleeve.