In this article I demonstrated how to use KSQL to filter streams of network event data. As well as filtering, KSQL can be used to easily enrich streams. In this article we’ll see how this enriched data can be used to drive analysis in Elasticsearch and Kibana—and how KSQL again came into use for building some stream processing as a result of the discovery made.
The data came from my home Ubiquiti router, and took two forms:
- A stream of network events from the router, sent over syslog to Apache Kafka
- Device information that the router stores in an internal MongoDB database, streamed into Kafka using Debezium and Kafka Connect
With KSQL I denormalised the two sets of data, enriching each network event with full details of the associated device, based on the device’s ID stored in each network event. The device information came from MongoDB, a copy of which was in a Kafka topic along with any changes that subsequently occurred in the MongoDB data (courtesy of CDC and Debezium).
From the Kibana dashboard I built, I noticed an interesting pattern. Around 29th April, there is a huge peak in activity relative to the rest of the time.
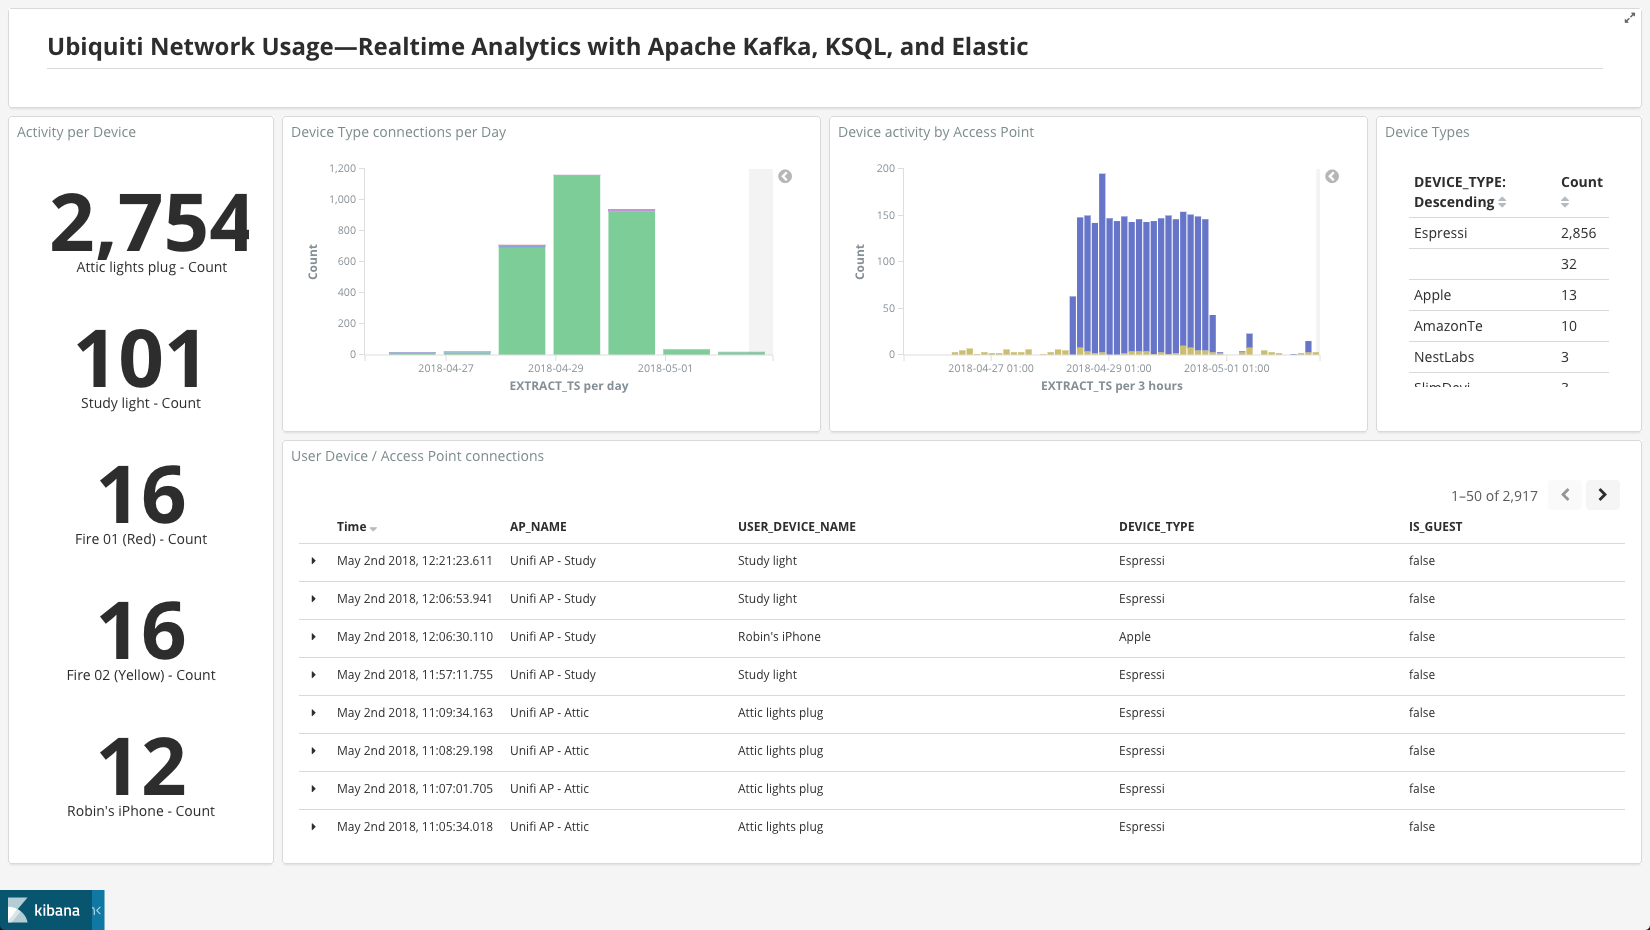
I wonder what’s causing this? Let’s drill into the data a bit more. Looking closely at the device type and Access Point, we can see it’s the “Attic” AP, and “Espressi” device types
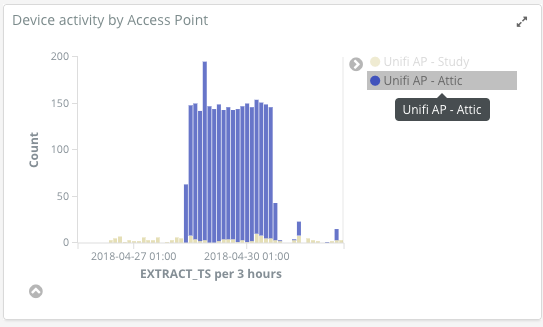
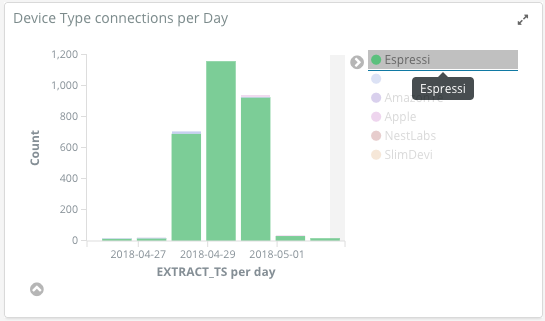
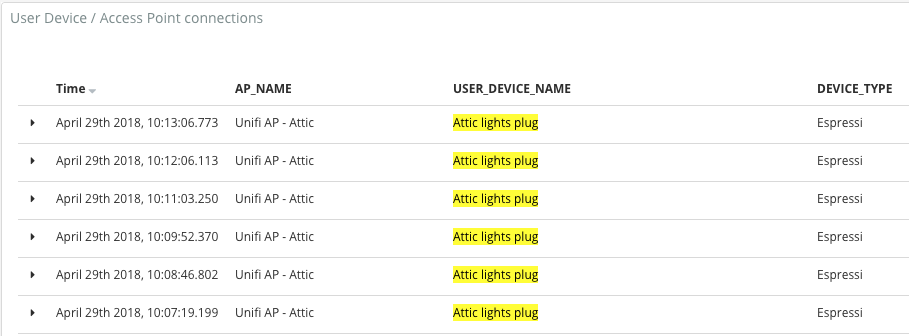
Using Kibana’s filtering to isolate the data to just these two facets, it’s clear that it’s just a particular device that’s so busy
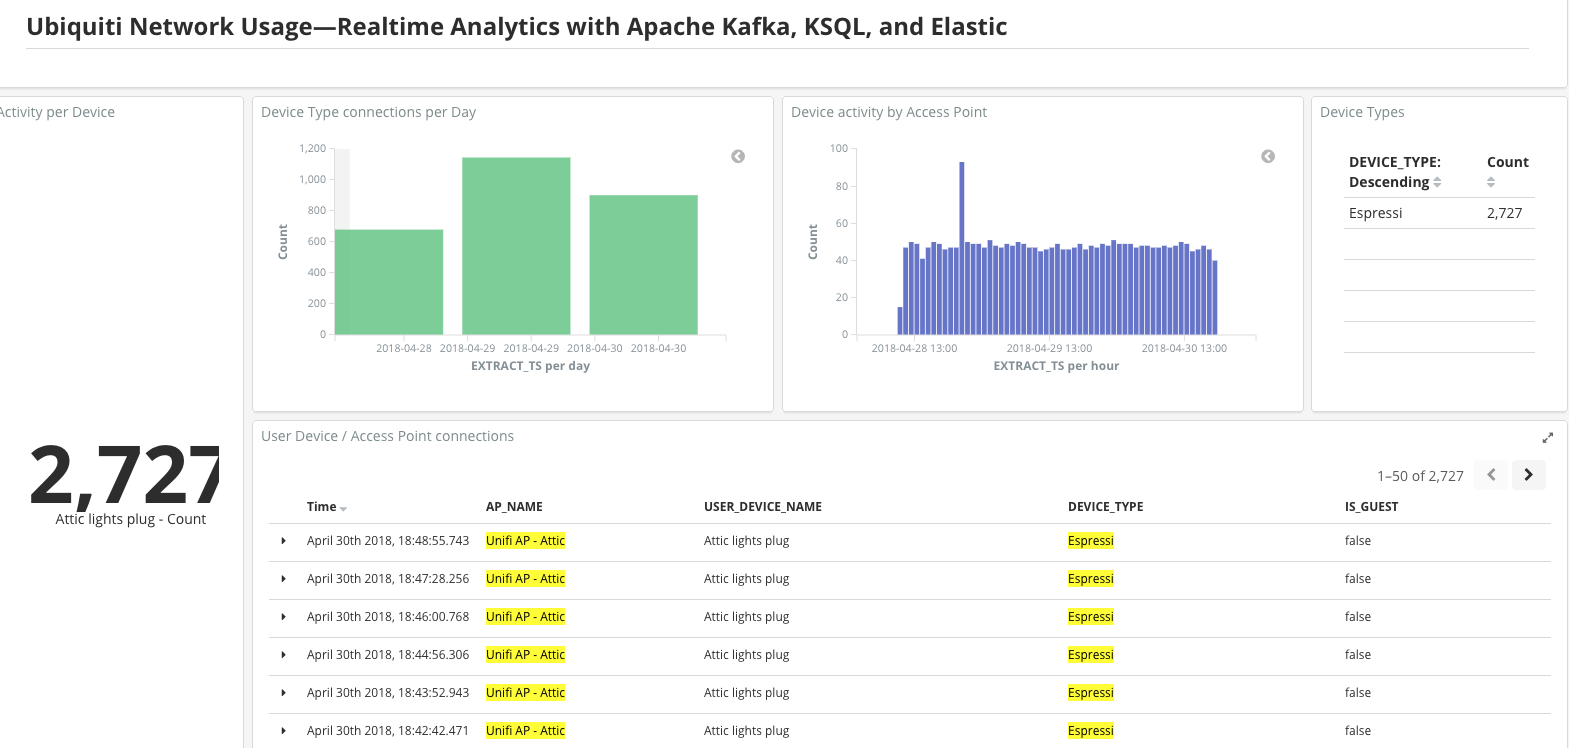
“Attic lights plug” is, as the name suggests, a wifi plug that I have controlling the lights in the attic of my house. But why’s it got so much activity, compared to usual? Let’s look at the times again:
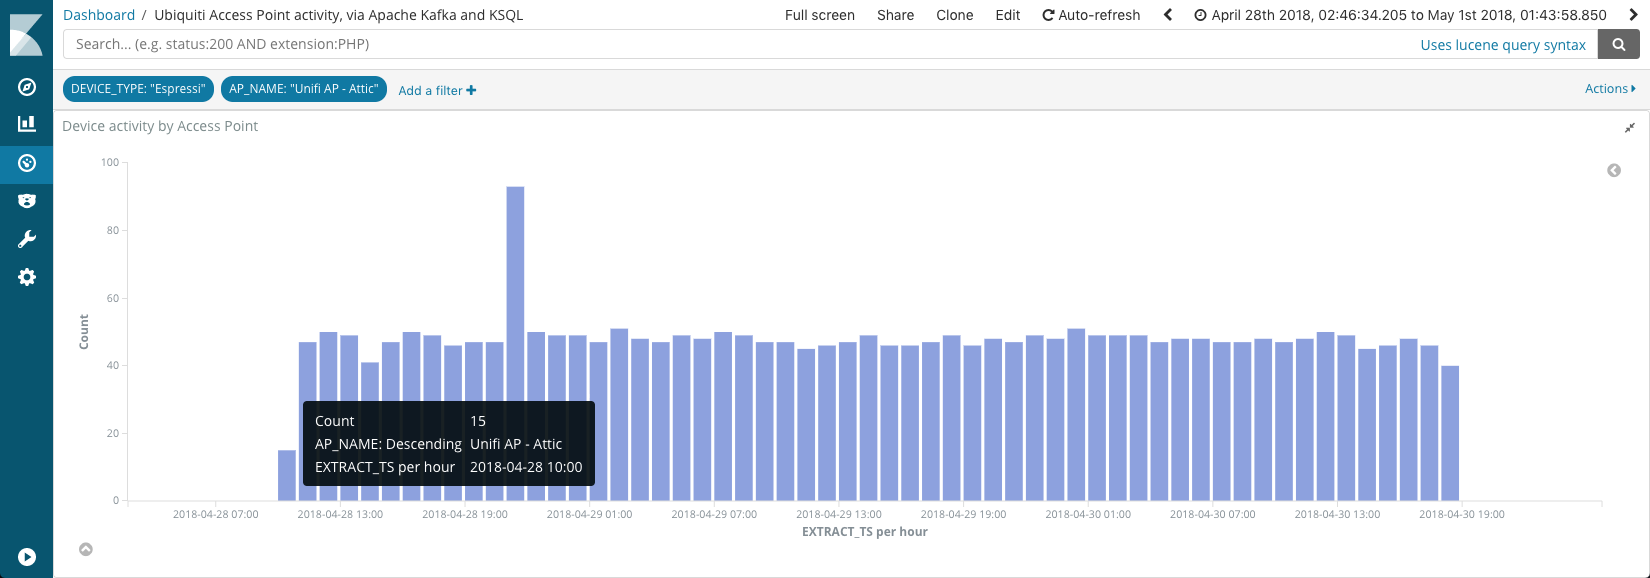
Roughly 10:00 on the 28th April, through to c.18:00 on the 30th April. The missing data here necessary for the automatic correlation is the howls of complaint from my kids when Netflix wouldn’t work this weekend—my home internet connection was down!
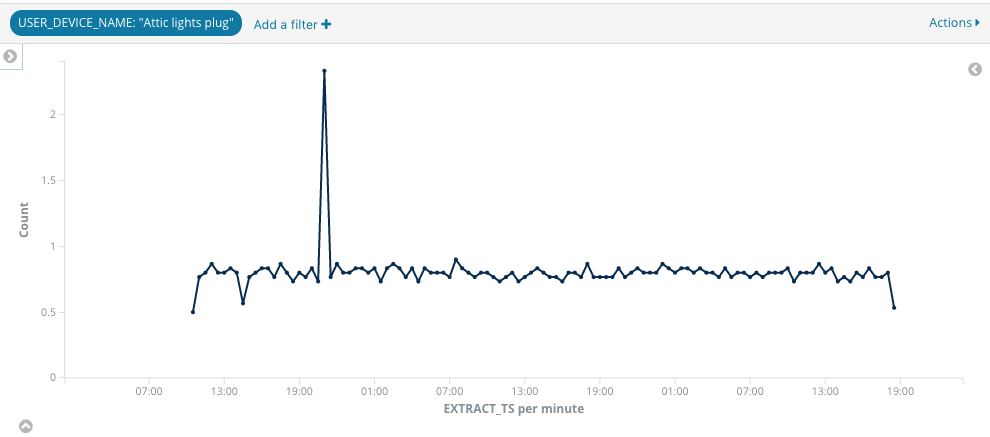
So from the looks of it, this wifi plug is not at all happy when it can’t ‘phone home’, and so tries reconnecting to the AP again…and again…and again!
The frequency works out at just under one connection attempt per minute, as can be seen from this graph:
So yay for dataviz and analytics. But—what can we do with this new-found knowledge? Watching a dashboard to look for this happening again is not so useful. Since we know what the pattern is, perhaps we can encode this into an application, and have an automatic alert tell me when it looks like my broadband’s gone offline?
The pattern we want to catch is:
- A particular device (“Attic lights plug”)
- Connecting to an Access Point
- At a rate of once per minute—or to not make it too sensitive, let’s say more than twice in a five minute period
Traditionally, doing this kind of realtime detection against a stream of inbound data would require some serious coding beyond the scope of many. Even seasoned programmers might not be familiar with the latest stream processing libraries. But what almost all programmers, developers, and even hand-crafted artisanal data engineers are familiar with is SQL! Let’s see what the above English statement of the pattern looks like in KSQL:
ksql> SELECT USER_DEVICE_NAME, COUNT(*) AS AP_CONNECT_COUNT \
FROM UBNT_AP_USER_DEVICE_CONNECTS WINDOW TUMBLING (SIZE 5 MINUTES) \
WHERE USER_DEVICE_NAME='Attic lights plug' \
GROUP BY USER_DEVICE_NAME \
HAVING COUNT(*)>2;

Attic lights plug | 7
Attic lights plug | 8
Attic lights plug | 7
Attic lights plug | 7
Attic lights plug | 5
Attic lights plug | 6
We can persist this as a Kafka topic, so that any new instances of this condition being met (i.e. a signal that my internet might be down!), are written to a Kafka topic that I can use to drive an alert:
CREATE TABLE OFFLINE_WARNING_SIGNAL AS \
SELECT USER_DEVICE_NAME, COUNT(*) AS AP_CONNECT_COUNT \
FROM UBNT_AP_USER_DEVICE_CONNECTS WINDOW TUMBLING (SIZE 5 MINUTES) \
WHERE USER_DEVICE_NAME='Attic lights plug' \
GROUP BY USER_DEVICE_NAME \
HAVING COUNT(*)>2;
Now I have a Kafka topic (OFFLINE_WARNING_SIGNAL) that I can do something like hook up to a Python driven alert as illustrated here. All this driven with a simple SQL expression, in effect giving us a full-blown stream processing application!
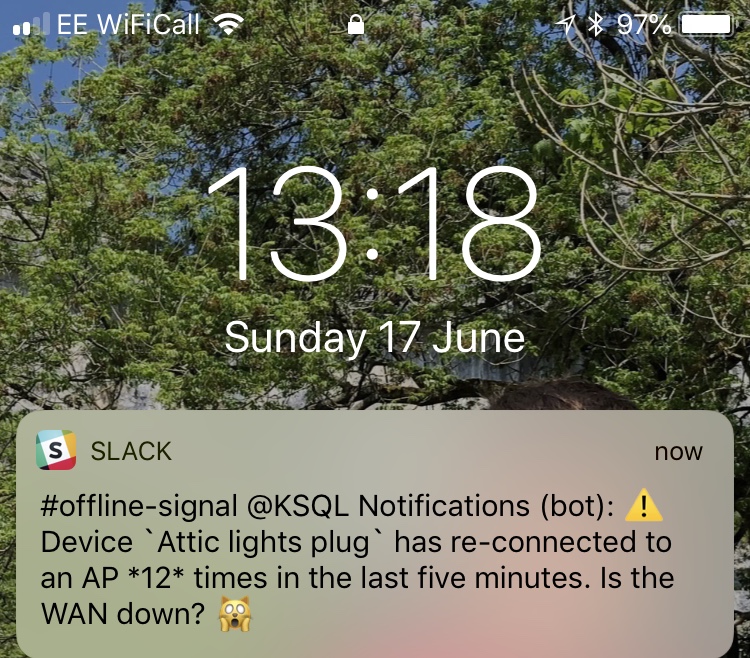
How cool is that: expressing patterns of interest in data, and building it into a real-time stream processing application, all using SQL!
