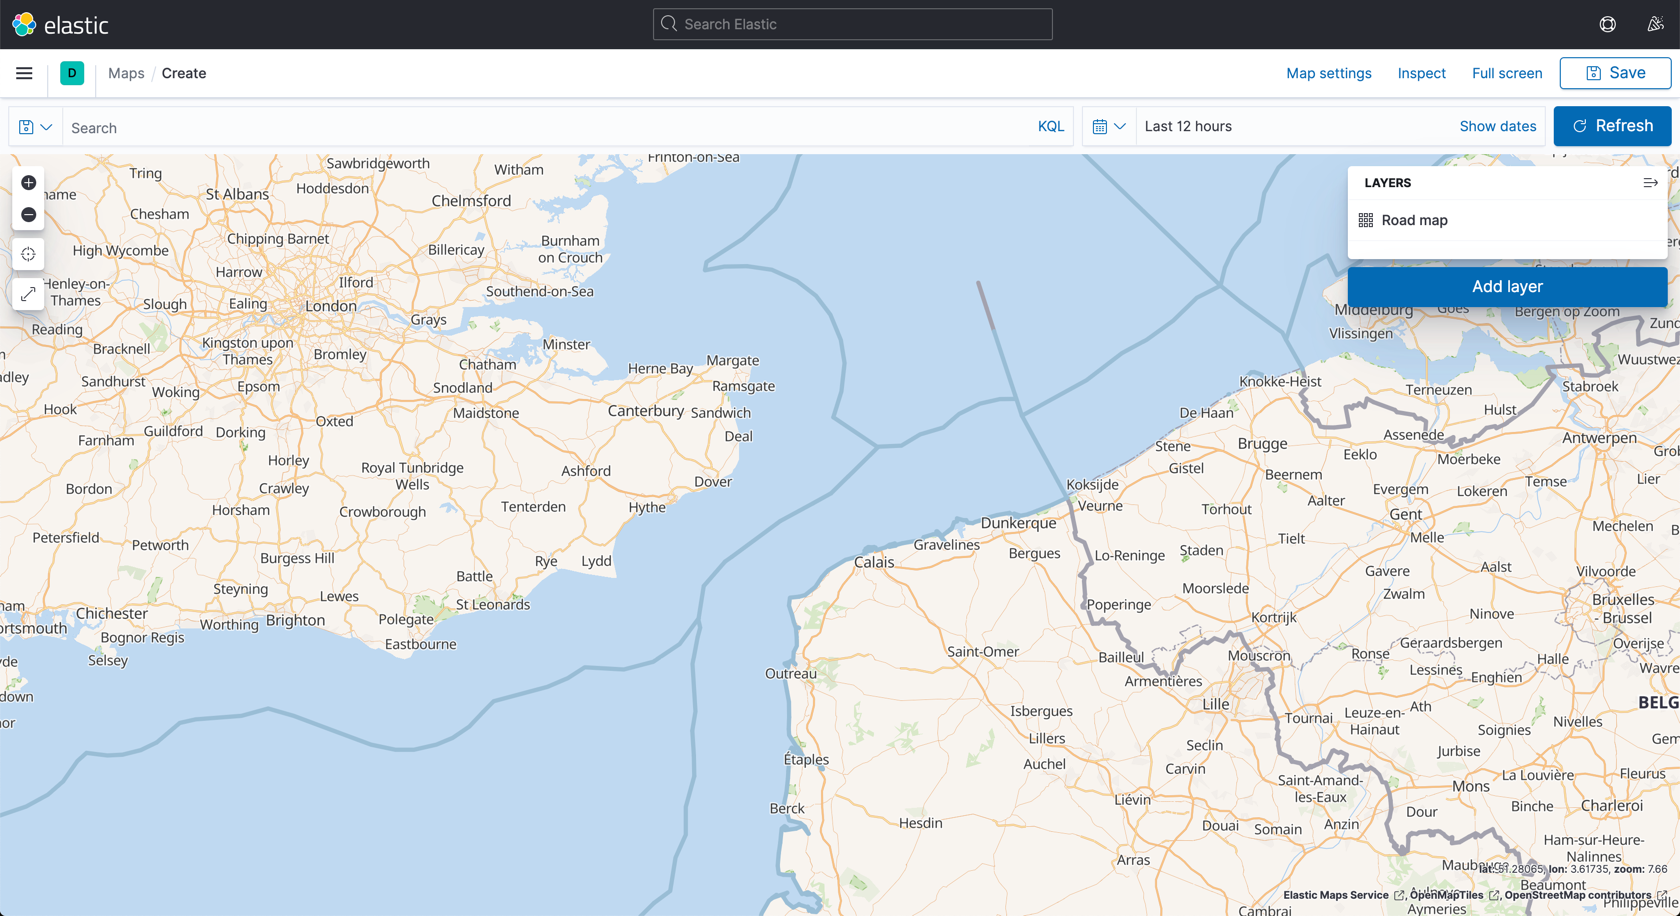
Kibana’s map functionality is a powerful way to visualise data that has a location element in it. I was recently working with data about ships at sea, and whilst the built in Road map is very good it doesn’t show much maritime detail.
Kibana’s map visualisation has the option to pull in additional visual information from other places (known as tile servers). I found a list of Tile servers, which had details of OpenSeaMap which includes:
beacons, buoys and other seamarks, port information, repair shops, ship supplies and much more, but also shops, restaurants and places of interest
Adding the tile server details is relatively easy - the trick is getting the incantation of the URL exactly right (which is why I’m even writing this up in the first place, because it took me a bit of fiddling).
-
Click on
Add layer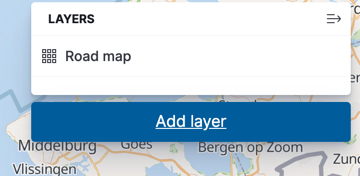
-
Select
Tile Map Service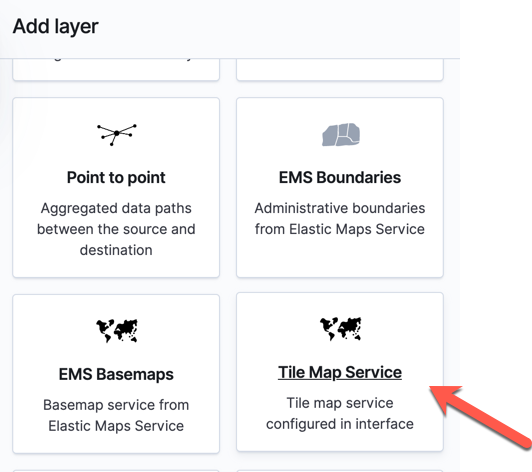
-
Enter the details
-
Attribution text:
OpenSeaMap -
Attrinbution link:
http://openseamap.org/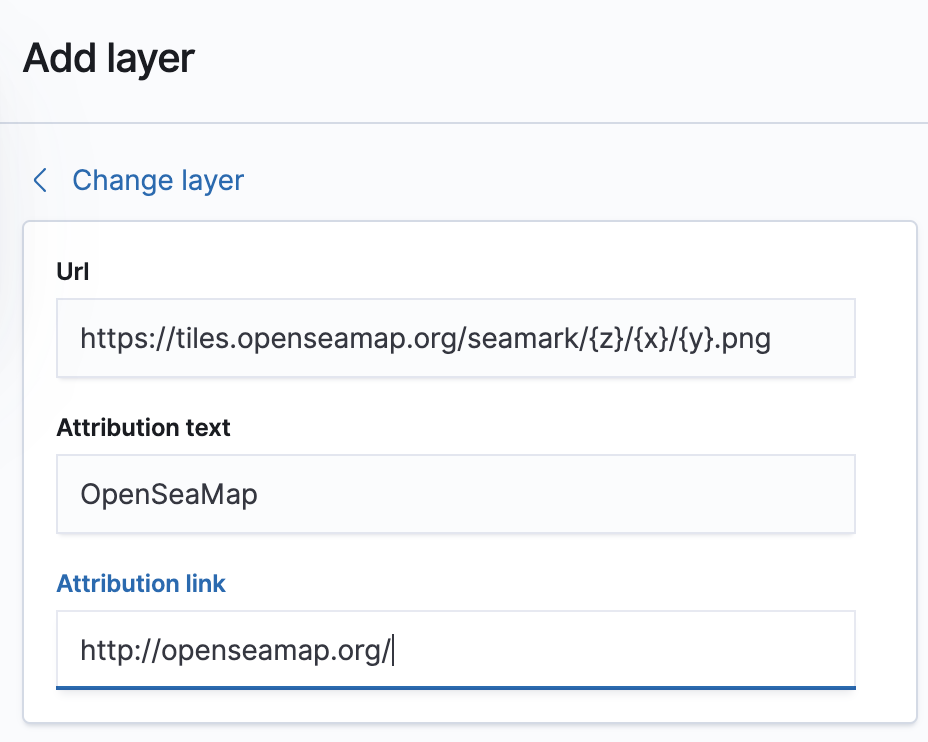
-
Click the
Add layerbutton at the bottom, and optionally give the layer a name on the next screen, and clickSave & close
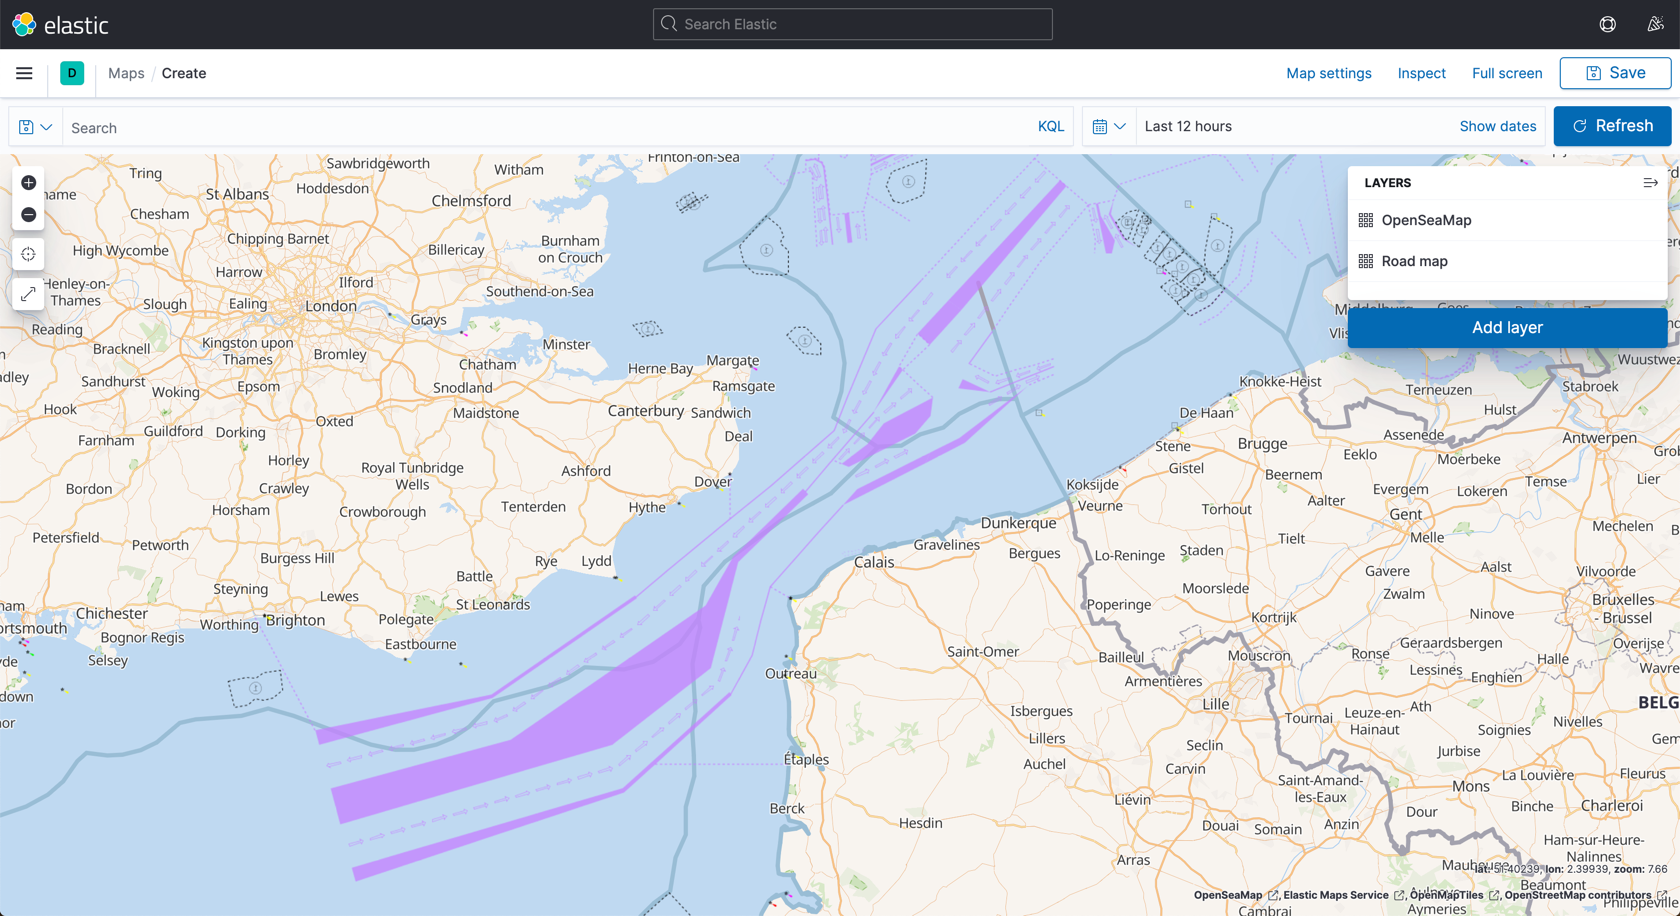
You now get visuals from OpenSeaMap overlaid, showing things like shipping lanes at a high level…
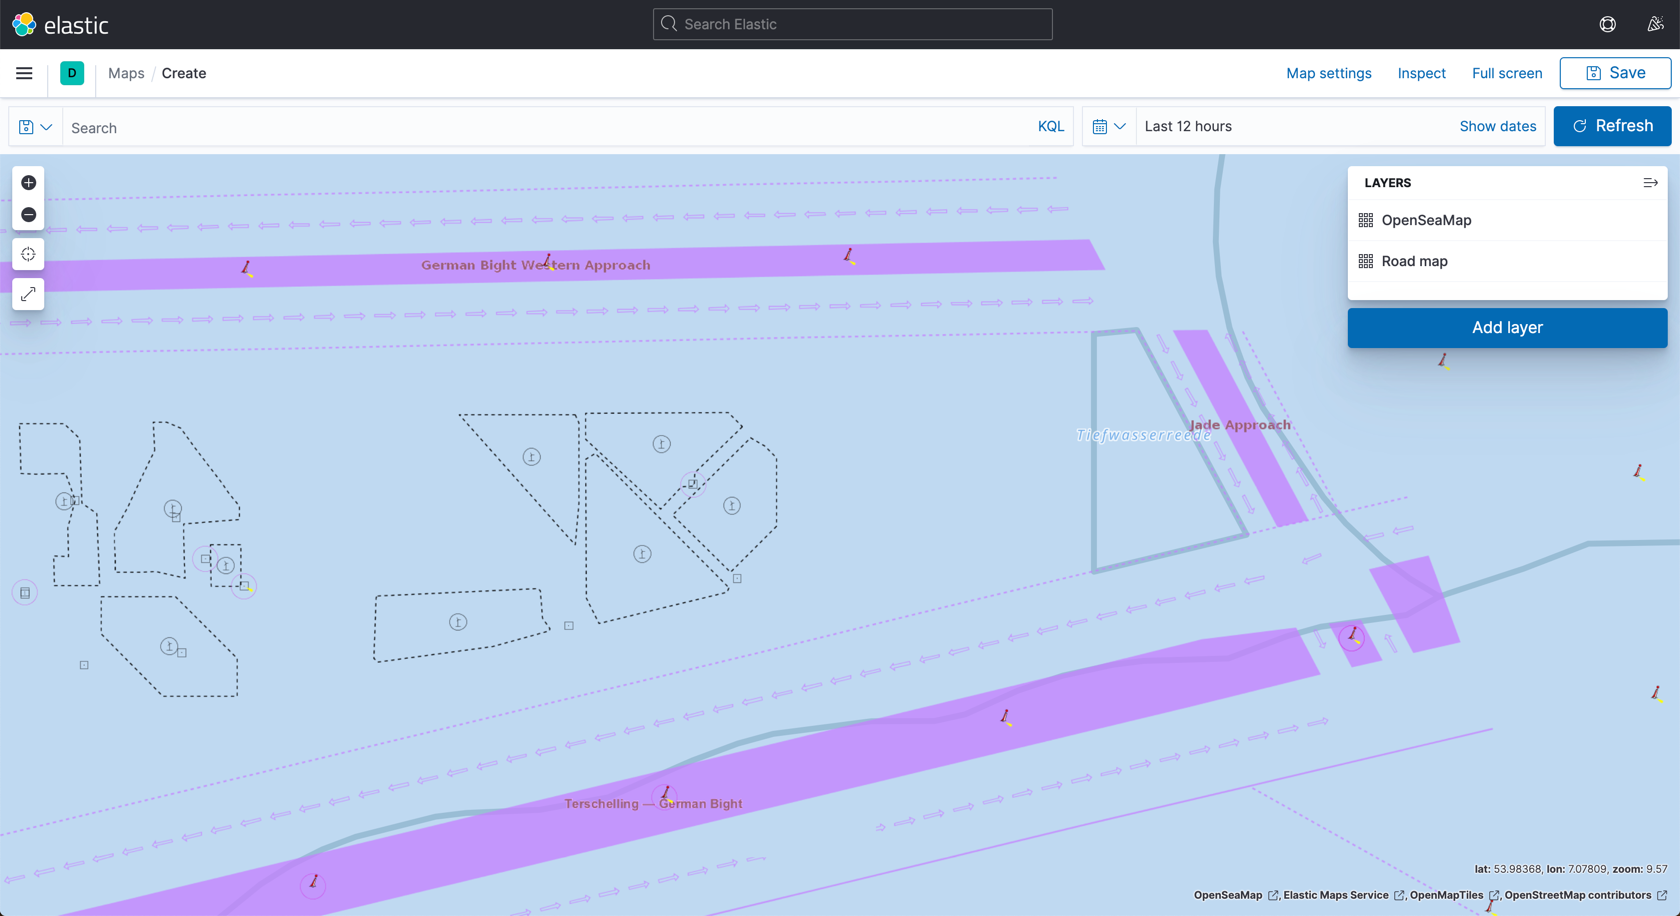
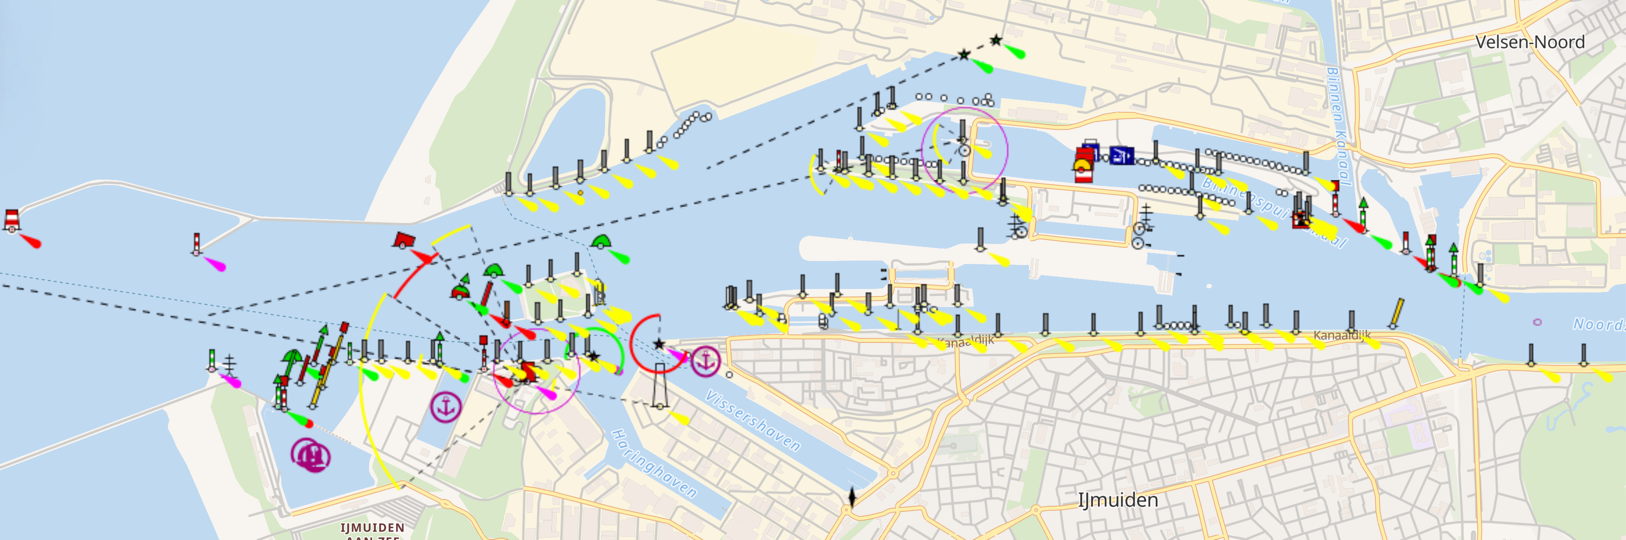
…down to much more detailed attributes:
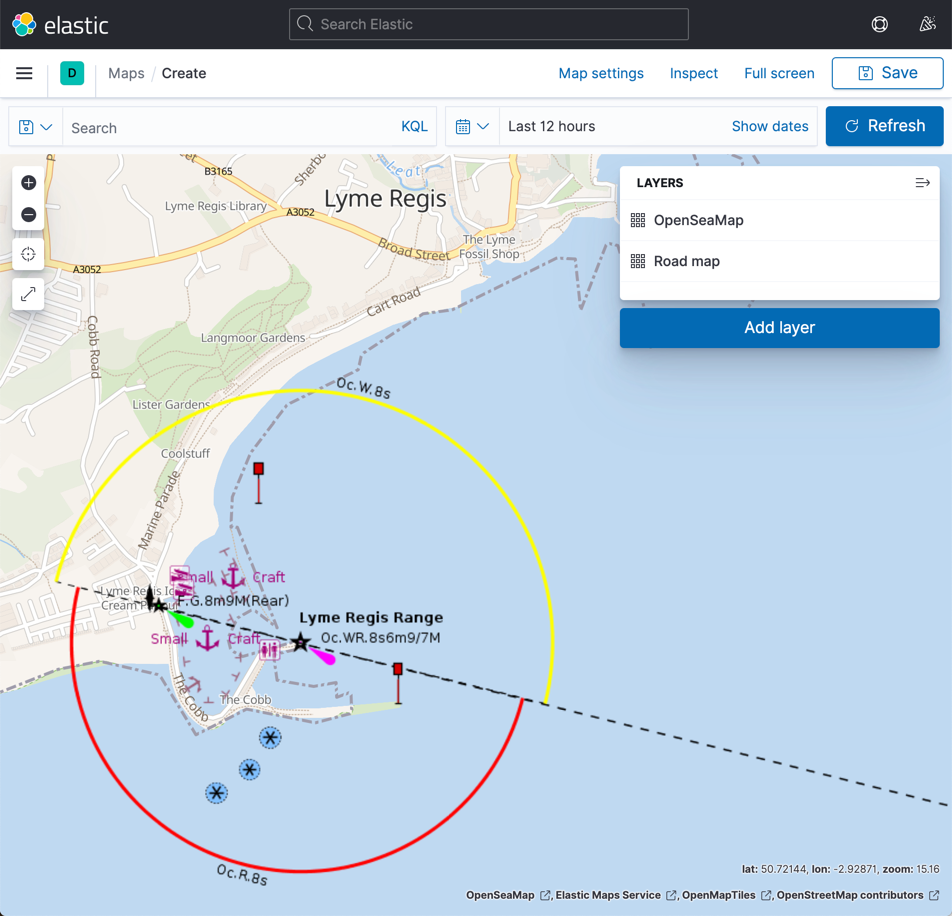
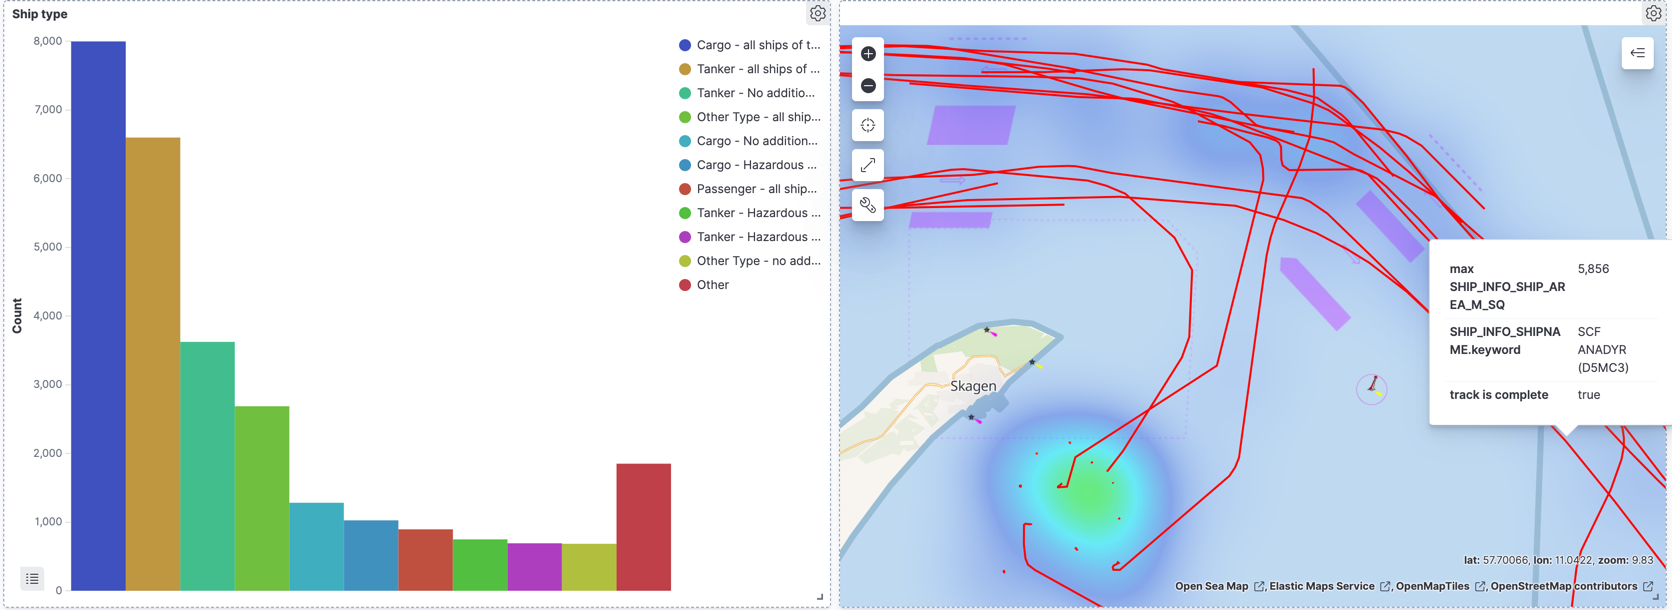
Of course, Kibana is not just a map viewer - it’s a data visualisation tool in which maps provide the canvas on which to illustrate the data, like this: