Sometimes you might want to access Apache Kafka that’s running on your local machine from another device not on the same network. I’m not sure I can think of a production use-case, but there are a dozen examples for sandbox, demo, and playground environments.
In this post we’ll see how you can use ngrok to, in their words, Put localhost on the internet. And specifically, your local Kafka broker on the internet.
⚠️ If you have trouble with ngrok, make sure to check that your DNS server is not blocking it.
Overview 🔗
Why? In my case, I wanted to expose my local Kafka as a source (and target) to Decodable so that I can process streams of data with Apache Flink through the managed service that Decodable provides.
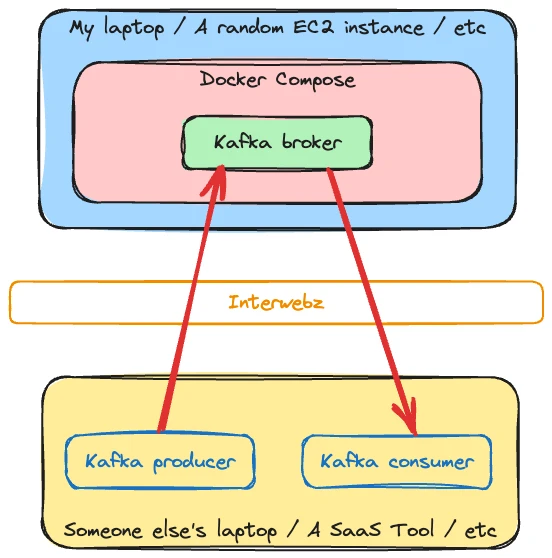
The example I’m going to show has ngrok and the Kafka broker running in a Docker Compose environment:
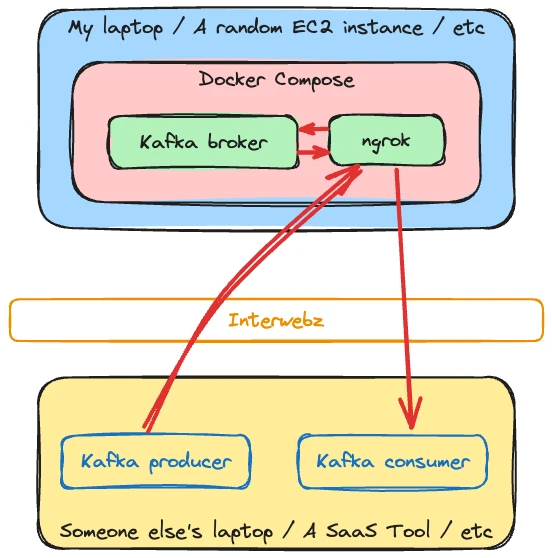
ngrok 🔗
ngrok has a free tier to use which works just fine for this, but you will need to create a free account to get your auth token. In this article I’m assuming you’ve exported your auth token to the environment variable NGROK_AUTH_TOKEN.
Kafka and Listeners and Advertised Listeners…oh my 🔗
In theory, using ngrok is straightforward. You configure a tunnel which routes a publicly-accessible host/port to one accessed from the ngrok agent running locally. Here we’re telling it to route the public tunnel to a machine called broker on port 9092:
ngrok tcp broker:9092 --authtoken $NGROK_AUTH_TOKEN
From this you get the tunnel url details:
t=2023-11-01T10:57:41+0000 lvl=info msg="started tunnel" obj=tunnels name=command_line addr=//broker:9092 url=tcp://6.tcp.eu.ngrok.io:13075
The tunnel URL is 6.tcp.eu.ngrok.io:13075. This is accessible from anywhere on the interwebz—locally or remote. Let’s try accessing our Kafka broker from another machine. I’m using my favourite tool, kcat. We’ll start by interogating the broker (-b) for metadata (-L):
$ kcat -L -b 6.tcp.eu.ngrok.io:13075

Metadata for all topics (from broker -1: 6.tcp.eu.ngrok.io:13075/bootstrap):
 1 brokers:
  broker 1 at localhost:9092 (controller)
 0 topics:
Look at that! It worked! 👏
Or did it…
$ echo "hello world" | kcat -b 6.tcp.eu.ngrok.io:13075 -P -t test_topic

%3|1698837177.570|FAIL|rdkafka#producer-1| [thrd:localhost:9092/1]: localhost:9092/1: Connect to ipv4#127.0.0.1:9092 failed: Connection refused (after 0ms in state CONNECT)
% ERROR: Local: Broker transport failure: localhost:9092/1: Connect to ipv4#127.0.0.1:9092 failed: Connection refused (after 0ms in state CONNECT)
%3|1698837177.804|FAIL|rdkafka#producer-1| [thrd:localhost:9092/1]: localhost:9092/1: Connect to ipv6#[::1]:9092 failed: Connection refused (after 0ms in state CONNECT)
% ERROR: Local: Broker transport failure: localhost:9092/1: Connect to ipv6#[::1]:9092 failed: Connection refused (after 0ms in state CONNECT)
[…]
oh no! 😖
So here’s what’s happening. Kafka is a distributed system; it’s only in sandbox/demo environments that you’d ever be running just a single broker. For this reason, you have a bootstrap address for one or more servers in the cluster. When you initially connect it’s to the bootstrap server (6.tcp.eu.ngrok.io:13075).
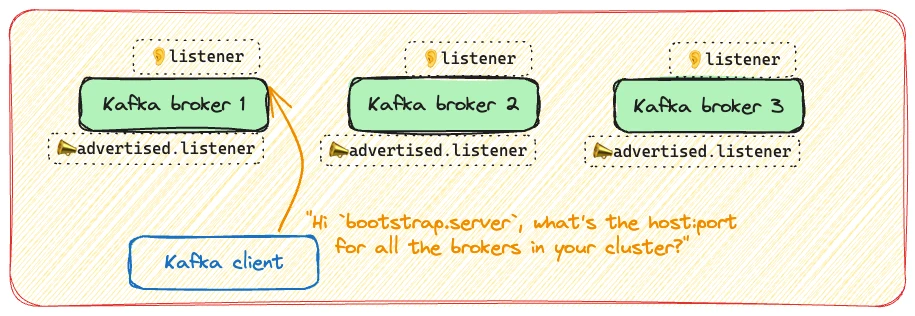
The server returns the advertised.listener for each of the brokers in the cluster as the address at which each of them can be found for subsequent connections.
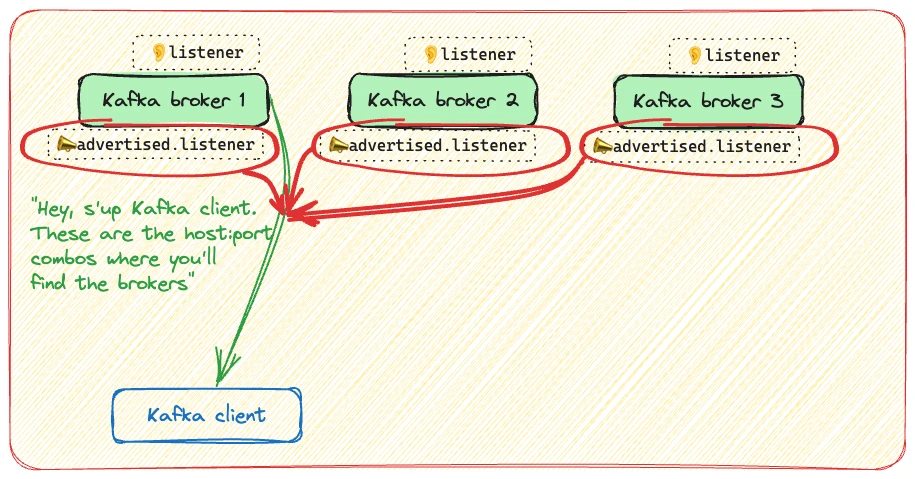
After the initial bootstrap connection, the client uses the address that was returned to connect to when producing or consuming records.
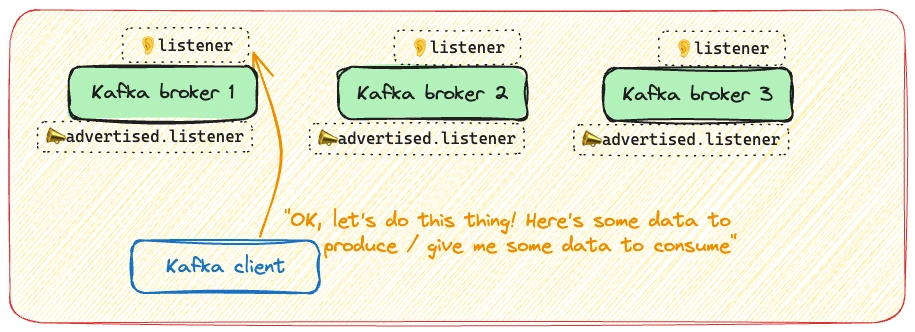
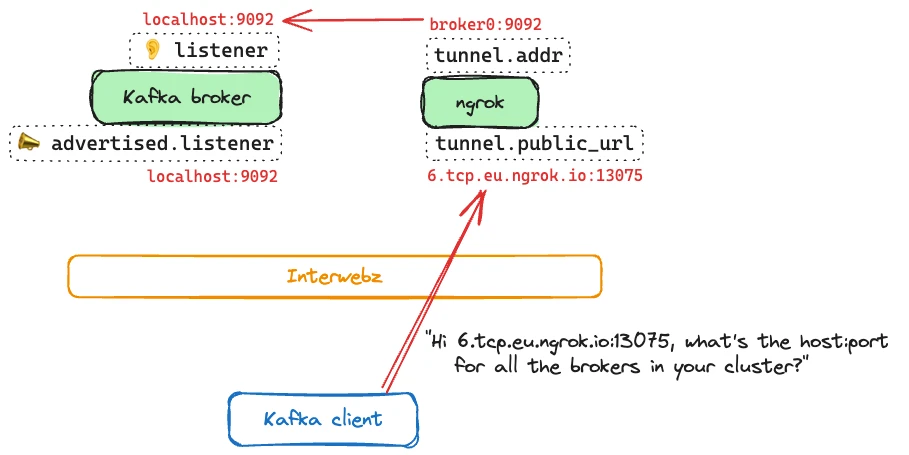
If we introduce ngrok into the mix it looks like this:
-
The Kafka client connects via the public ngrok tunnel address to the broker for bootstrap connection
-
The Kafka broker returns a list of available brokers, with their
advertised.listeneraddress (localhost:9092)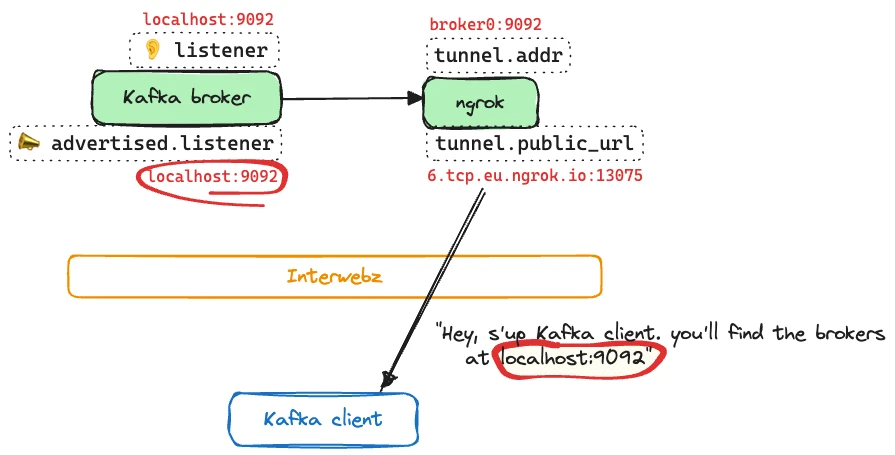
-
The Kafka client tries to connect to the address given—
localhost:9092—to produce/consume data. Since there’s no Kafka broker running local to the Kafka client (i.e. atlocalhost:9092) the connection fails.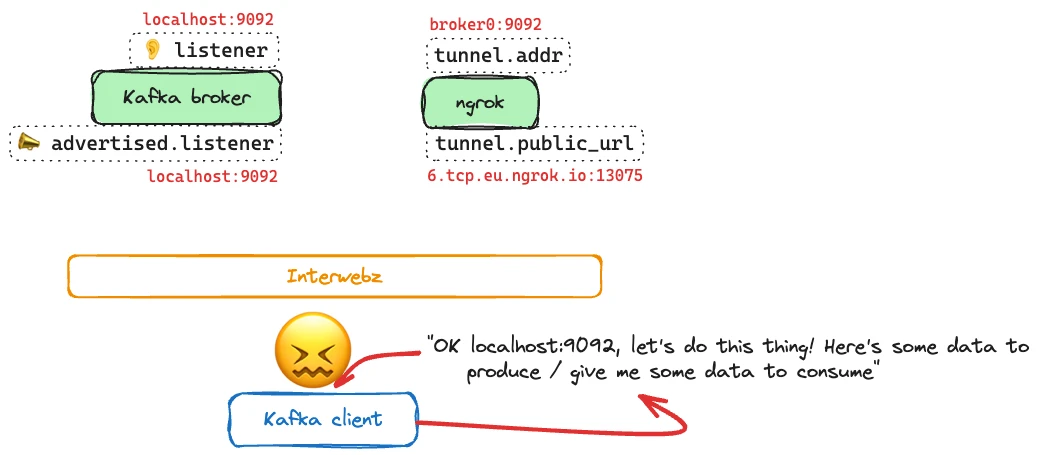
(If you want to get into this in more detail about this please see my previous article about working with advertised.listeners)
Making it work 🔗
We need to get the ngrok tunnel URL and configure that as the Kafka broker’s advertised.listener:
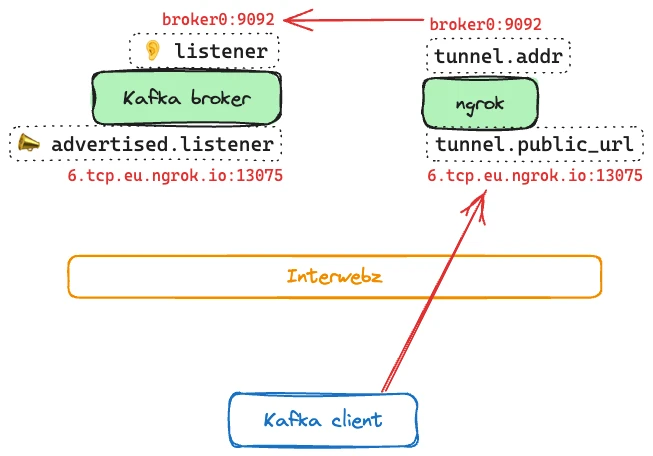
Let’s look at what’s actually involved in doing this.
I’m using Docker to run Kafka, so the configuration I’m going to discuss is through the environment variables passed to the image.
The first thing is to configure the listeners. This defines where the broker binds to for listening to inbound connections. I’m using two listeners; one for regular traffic between Docker containers, and the other for ngrok traffic. Listeners can be arbitrarily named, so I’m using nice clear labels here. The listener’s label servers as a prefix to the host and port.
DOCKERNGROK
The only—but crucial—difference is the port on which they listen. The port on which a connection receives determines the listener used, and therefore the advertised listener that’s served in response.
KAFKA_LISTENERS: DOCKER://broker:29092, NGROK://broker:9092
Now we configure the advertised listeners:
KAFKA_ADVERTISED_LISTENERS: DOCKER://broker:29092, NGROK://6.tcp.eu.ngrok.io:13075
For completeness, we need two more listener configuration items:
KAFKA_INTER_BROKER_LISTENER_NAME: DOCKER
KAFKA_LISTENER_SECURITY_PROTOCOL_MAP: DOCKER:PLAINTEXT,NGROK:PLAINTEXT
Automating it 🔗
Now, this is all very well. But there’s a complication. ngrok uses a random host and port each time the tunnel is created. This means that to configure the Kafka broker with the correct advertised listener we need to know the tunnel first. That also makes building a static configuration for our Kafka broker tricky—for example, in Docker Compose.
So what we need to do is:
- Launch ngrok and create tunnel
- Determine the tunnel URL and add it to the advertised listener configuration for Kafka
- Launch the Kafka broker
What prompted this whole exercise was wanting to build a standalone artefact that could be used to easily spin up Kafka locally to connect to Decodable in the cloud. Manually hacking around config is fine as a one-off, but I wanted something repeatable and as automated as possible.
Wrangling around Docker Compose 🔗
This is what I ended up doing in Docker Compose. I’d love to hear your feedback if there’s a smarter or more idiomatic way in which to accomplish the same :)
First, run ngrok and create the tunnel. This is hardcoded to direct traffic to the Kafka container at broker:9092.
  ngrok:
    image: ngrok/ngrok:latest
    container_name: ngrok
    command: tcp broker:9092 --log stdout --authtoken $NGROK_AUTH_TOKEN
    ports:
      - 4040:4040
ngrok has a REST API, which we can query to get the tunnel URL (public_url):
$ curl http://localhost:4040/api/tunnels/command_line | jq '.'

{
  "name": "command_line",
  "ID": "10c495e397bd65f42f3d4ebbd1bb74f5",
  "uri": "/api/tunnels/command_line",
  "public_url": "tcp://0.tcp.eu.ngrok.io:16761",
  "proto": "tcp",
  "config": {
    "addr": "broker:9092",
    "inspect": false
  },
Now we are ready to look at the Kafka broker. The chaining is defined with the Docker Compose’s depends_on:
depends_on:
    - zookeeper
    - ngrok
What I’ve done is define the constant listener variables in the Docker Compose service entry for the broker, whilst leaving KAFKA_ADVERTISED_LISTENERS with a single entry and nothing for ngrok yet:
KAFKA_LISTENERS: DOCKER://broker:29092, NGROK://broker:9092
KAFKA_ADVERTISED_LISTENERS: DOCKER://broker:29092
KAFKA_INTER_BROKER_LISTENER_NAME: DOCKER
KAFKA_LISTENER_SECURITY_PROTOCOL_MAP: DOCKER:PLAINTEXT,NGROK:PLAINTEXT
I’ve then overriden the entrypoint of the container. First, it will wait for the tunnel to be created:
echo "Waiting for ngrok tunnel to be created"
while : ; do
    curl_status=$(curl -s -o /dev/null -w %{http_code} http://ngrok:4040/api/tunnels/command_line)
    echo -e $(date) "\tTunnels API HTTP state: " $curl_status " (waiting for 200)"
    if [ $curl_status -eq 200 ] ; then
    break
    fi
    sleep 5
done
echo "ngrok tunnel is up"
Then—in the absence of jq on the confluentinc/cp-kafka image—I use some fairly nasty shell tool code (which will probably break if the JSON structure from the ngrok API changes) to add the tunnel’s URL to the advertised listeners environment variable:
NGROK_LISTENER=$(curl -s  http://ngrok:4040/api/tunnels/command_line | grep -Po '"public_url":.*?[^\\]",' | cut -d':' -f2- | tr -d ',"' | sed 's/tcp:\/\//NGROK:\/\//g')
export KAFKA_ADVERTISED_LISTENERS="$KAFKA_ADVERTISED_LISTENERS, $NGROK_LISTENER"
echo "KAFKA_ADVERTISED_LISTENERS is set to " $KAFKA_ADVERTISED_LISTENERS
And then, finally, we launch the Kafka broker (using the original value of the Docker image’s entrypoint):
/etc/confluent/docker/run
ngrok with Kafka on Docker Compose, in action 🔗
You can find the Docker Compose file here
Launch the Docker Compose stack:
$ docker compose up
Get the ngrok tunnel URL:
$ curl -s localhost:4040/api/tunnels | jq -r '.tunnels[0].public_url'

tcp://2.tcp.eu.ngrok.io:16738
(you can also use the Web UI at http://localhost:4040 to get this info)
Now from anywhere on the interwebz, use your local Kafka broker based on the URL returned from ngrok (minus the tcp:// prefix):
$ echo "hello world" | kcat -b 2.tcp.eu.ngrok.io:16738 -P -t test_topic
$
$ kcat -b 2.tcp.eu.ngrok.io:16738 -C -t test_topic
hello world
% Reached end of topic test_topic [0] at offset 1
If you go and have a look at your Docker Compose log you’ll see information about network traffic flowing through the tunnel:
ngrok | t=2023-11-01T12:17:59+0000 lvl=info msg="join connections" obj=join id=8db744a20159 l=192.168.117.4:9092 r=82.20.253.111:34870
So there we have it—ngrok and Kafka, nicely automated in a standalone Docker Compose file 😎
