Whether you’re processing data in batch or as a stream, the concept of time is an important part of accurate processing logic.
Because we process data after it happens, there are a minimum of two different types of time to consider:
-
When it happened, known as Event Time
-
When we process it, known as Processing Time (or system time or wall clock time)
In the days of yore, event time could be different from processing time by many hours. At 9am a supermarket opens and I buy a tin of baked beans. At 6pm the store closes, the end-of-day runs on the in-store PoS, and sends the data back to head office. Perhaps at 10pm all the data from all the stores has been received and processing starts.
In the modern age, many platforms will be much lower latency. PoS systems would be sending information about my tin of baked beans purchase back to a central system (probably using Apache Kafka…) as soon as it happened. But even then, times can differ. There’s the natural latency on which the speed of light has a strong opinion, on top of which is any other processing or batching that might be introduced along the way. Then there are power outages and network blips and gremlins that can mean records can be significantly delayed.
Then there’s a whole category of data that wasn’t a significant thing in the past—data that’s generated from mobile devices. Even with improving cellular coverage and in-flight wifi, data can still be delayed by minutes or hours.
So that’s event time and processing time. But there are other types of time too:
-
The time the record was written in the system
-
The time a record was first created
-
The time a record was last updated
-
Arbitrary time fields on a record, such as an order record with times that the order was place, fulfilled, and shipped
I’ll come back to these in detail later. For now, just keep in mind that there is no single "correct" time to use. It depends on what your processing is supposed to be doing. If you are trying to calculate how many orders were shipped in the last hour, then using the time that the order was created or that it landed in the processing system would give you an answer—it would just be the wrong one.
In this article I’m going to look at how we deal with time when it comes to using it in event-based systems such as Kafka and Apache Flink.
| This seminal article from Tyler Akidau is nearly ten years old, but is still a highly relevant and excellent read and covers a lot of what you need to know about time in stream processing. |
Time in Apache Kafka 🔗
Each Kafka message is made up of several parts:
-
Key
-
Value (the payload)
-
Header
-
Timestamp
Here’s an example record. The value is in JSON, which I’ve pretty-printed to make it easier to follow:
Key (14 bytes): {"order_id":1}
Value (205 bytes):
    {
        "order_id": 1,
        "customer_id": 1001,
        "total_amount": 149.99,
        "status": "pending",
        "created_at": "2025-04-25 09:44:25",
        "shipped_at": null,
        "shipping_address": "221B Baker Street, London",
        "payment_method": "Credit Card"
    }
Timestamp: 1745587589625
There are two times here:
-
The event time which we’ll take as
created_atfrom the value:2025-04-25 09:44:25. -
The timestamp of the Kafka message:
1745587589625. This is the milliseconds since the epoch, and converts to2025-04-25 13:26:29.625.
The timestamp of a Kafka message can be set explicitly by the producer.
If it’s not set explicitly then the producer sets the timestamp to the current time when it sends the message to the broker.
The timestamp that’s included in the message written by the broker depends on the message.timestamp.type topic configuration.
If this is set to CreateTime then it uses the time from the producer (either explicit or implicitly set), or it can use the time on the broker when the record is written (LogAppendTime).
In theory you could use the Timestamp field of the Kafka message to hold the event time; the data is being stored anyway, so why not optimise by not holding it twice?
The disadvantage of this comes if you’re using a system which doesn’t expose the timestamp metadata of a message, so if in doubt, keep it simple :)
Plus, it might also be useful to have both these values as it would tell you the delay between creation of events and ingesting them into Kafka (assuming you’re using LogAppendTime) if you needed this information for performance troubleshooting.
Time in Apache Flink 🔗
The longer you’ve been working with Flink, the higher the chances are that you’ve heard the word "Watermark". I must profess to having spent the last 18 months—since I started working with Flink—with my head in the sand, somewhat ostrich-like, when it comes to Watermarks. They’re spoken of in hushed tones and with great reverence. They seem to cause great wailing and gnashing of teeth. Conference talks are written about them.
In a very rough nut-shell, watermarks define where on the sliding scale between data completeness and data freshness you want your Flink processing to be.
I am going to write about watermarks in this article…just not quite yet. That’s because I want to first look at one of the underlying building blocks for watermarks, and that is the concept of a Time Attribute in Flink. There are two types of time attribute:
-
Event Time
✨ If you don’t care about event time, you can also forget about watermarks. Watermarks are an event-time only thing ✨ -
Processing Time
-
a.k.a. Wall Clock
-
Both of these map to the explanations above; when something happened (event time) and when it was processed (…erm, processing time!).
The Flink documentation has some good reference pages on this topic, including 📖 Notions of Time: Event Time and Processing Time and 📖 Introduction to Time Attributes.
Time attributes are used when doing certain processing with Flink that has a time element to it. If you don’t have one you’ll get errors like:
The window function requires the timecol is a time attribute typeJust because a column is a timestamp, it doesn’t mean that it’s a time attribute. A time attribute is a specific characteristic in a Flink SQL table, and you need to explicitly declare it:
-
An event time column is denoted implicitly as a time attribute by assigning a
WATERMARK FORstatement to it in the table DDL. -
To add a time attribute for processing time to a table use a computed column with the
PROCTIME()function.
Let’s look at this in practice, using a table defined over an existing Kafka topic.
Time in Kafka in Flink 🔗
Here’s our Kafka message from above:
Key (14 bytes): {"order_id":1}
Value (205 bytes):
    {
        "order_id": 1,
        "customer_id": 1001,
        "total_amount": 149.99,
        "status": "pending",
        "created_at": "2025-04-25 09:44:25",
        "shipped_at": null,
        "shipping_address": "221B Baker Street, London",
        "payment_method": "Credit Card"
    }
Timestamp: 1745488756689
Let’s now create a Flink table for this Kafka topic and explore time attributes. We’ll start off with no declared time attributes:
CREATE TABLE orders_kafka (
    order_id INT,
    customer_id INT,
    total_amount DECIMAL(10, 2),
    status STRING,
    created_at TIMESTAMP(3),
    shipped_at TIMESTAMP(3),
    shipping_address STRING,
    payment_method STRING,
    PRIMARY KEY (order_id) NOT ENFORCED
) WITH (
    'connector' = 'upsert-kafka',
    'topic' = 'orders_cdc',
    'properties.bootstrap.servers' = 'broker:9092',
    'key.format' = 'json',
    'value.format' = 'json'
);
Here, we only see the event time column that we defined in the schema (created_at):
SELECT * FROM orders_kafka;+----+-------------+-------------+--------------+------------+-------------------------+[…]
| op | order_id | customer_id | total_amount | status | created_at |[…]
+----+-------------+-------------+--------------+------------+-------------------------+[…]
| +I | 1 | 1001 | 149.99 | pending | 2025-04-25 09:44:25.000 |[…]We can access the timestamp of the Kafka message if we add a metadata column:
ALTER TABLE orders_kafka
    ADD `kafka_record_ts` TIMESTAMP_LTZ(3) METADATA FROM 'timestamp';
This metadata column looks like this in the schema:
Flink SQL> DESCRIBE orders_kafka;
+------------------+------------------+-------+---------------+---------------------------+-----------+
|             name |             type |  null |           key |                    extras | watermark |
+------------------+------------------+-------+---------------+---------------------------+-----------+
|         order_id |              INT | FALSE | PRI(order_id) |                           |           |
|      customer_id |              INT |  TRUE |               |                           |           |
|     total_amount |   DECIMAL(10, 2) |  TRUE |               |                           |           |
|           status |           STRING |  TRUE |               |                           |           |
|       created_at |     TIMESTAMP(3) |  TRUE |               |                           |           |
|       shipped_at |     TIMESTAMP(3) |  TRUE |               |                           |           |
| shipping_address |           STRING |  TRUE |               |                           |           |
|   payment_method |           STRING |  TRUE |               |                           |           |
|  kafka_record_ts | TIMESTAMP_LTZ(3) |  TRUE |               | METADATA FROM 'timestamp' |           |
+------------------+------------------+-------+---------------+---------------------------+-----------+
9 rows in set
Now we can query it:
SELECT order_id, created_at, kafka_record_ts FROM orders_kafka;+----+-------------+-------------------------+-------------------------+
| op | order_id | created_at | kafka_record_ts |
+----+-------------+-------------------------+-------------------------+
| +I | 1 | 2025-04-25 09:44:25.000 | 2025-04-25 13:26:29.625 |This matches the timestamps above that we observed in the raw Kafka message—except the kafka_record_ts is displayed here in UTC whereas the conversion that I did above gave it in BST (UTC+1).
Aren’t timestamps fun!? ;)
If we want the processing time attribute in Flink we need another special column:
ALTER TABLE orders_kafka
    ADD `flink_proc_time` AS PROCTIME();
Now we have three timestamps :)
SELECT order_id, created_at, kafka_record_ts, flink_proc_time FROM orders_kafka;+----+-------------+-------------------------+-------------------------+-------------------------+
| op | order_id | created_at | kafka_record_ts | flink_proc_time |
+----+-------------+-------------------------+-------------------------+-------------------------+
| +I | 1 | 2025-04-25 09:44:25.000 | 2025-04-25 13:26:29.625 | 2025-04-25 15:09:57.349 |If I re-run the query I get this: (note that the flink_proc_time changes whilst the others don’t)
+----+-------------+-------------------------+-------------------------+-------------------------+
| op |    order_id |              created_at |         kafka_record_ts |         flink_proc_time |
+----+-------------+-------------------------+-------------------------+-------------------------+
| +I |           1 | 2025-04-25 09:44:25.000 | 2025-04-25 13:26:29.625 | 2025-04-25 15:10:09.743 |
The processing time attribute is literally just the time at which the data is passing through Flink. You may have figured already by now, but since the processing time is just the wall clock, queries using processing time are going to be non-deterministic. Contrast that to event time attribute in which it’s part of the actual data, making the queries less non-deterministic… 😁. That is, when you re-run the query, you’re more likely to get the same results.
|
🫣 There isn’t such a thing as "less non-deterministic". Whilst processing-time based queries are going to by definition be non-deterministic (because the processing time i.e. wall clock time will be different each time), event time based queries can be deterministic only if the watermark is generated after each event. In reality, watermarks are generated periodically when data arrives—by default, every 200ms.
You can change this interval, as well as configure watermarks to be generated per-event ( |
It’s time… 🔗
Let’s now actually run a query in Flink that relies on time.
I’ve added another row of data to the Kafka topic, meaning that the data in Flink now looks like this:
SELECT order_id, created_at, kafka_record_ts, flink_proc_time FROM orders_kafka;+----+-------------+-------------------------+-------------------------+-------------------------+
| op | order_id | created_at | kafka_record_ts | flink_proc_time |
+----+-------------+-------------------------+-------------------------+-------------------------+
| +I | 1 | 2025-04-25 09:44:25.000 | 2025-04-25 13:26:29.625 | 2025-04-25 15:10:09.743 |
| +I | 2 | 2025-04-25 09:44:28.000 | 2025-04-25 13:26:35.928 | 2025-04-25 15:10:09.743 |We’ll count how many orders were placed every minute. For this we can use a tumbling window:
SELECT  window_start,
        window_end,
        COUNT(*) as event_count
FROM TABLE(
        TUMBLE(TABLE orders_kafka,
                DESCRIPTOR(created_at),
                INTERVAL '1' MINUTE)
        )
GROUP BY window_start, window_end;
Now we hit our first problem:
[ERROR] Could not execute SQL statement. Reason:
org.apache.flink.table.api.ValidationException:
The window function requires the timecol is a time attribute type, but is TIMESTAMP(3).
The timecol in this message means the time column that we specified in the query as the one to use in the time-based aggregated—created_at.
But even though created_at is a timestamp, it’s not a time attribute.
Recall that above we detailed the two types of time attribute in Flink:
-
Event Time
-
Processing Time (a.k.a. Wall Clock)
We do have a time attribute on the table—flink_proc_time
Flink SQL> DESCRIBE orders_kafka;
+------------------+-----------------------------+-------+---------------+---------------------------+-----------+
|             name |                        type |  null |           key |                    extras | watermark |
+------------------+-----------------------------+-------+---------------+---------------------------+-----------+
|         order_id |                         INT | FALSE | PRI(order_id) |                           |           |
|      customer_id |                         INT |  TRUE |               |                           |           |
|     total_amount |              DECIMAL(10, 2) |  TRUE |               |                           |           |
|           status |                      STRING |  TRUE |               |                           |           |
|       created_at |                TIMESTAMP(3) |  TRUE |               |                           |           |
|       shipped_at |                TIMESTAMP(3) |  TRUE |               |                           |           |
| shipping_address |                      STRING |  TRUE |               |                           |           |
|   payment_method |                      STRING |  TRUE |               |                           |           |
|  kafka_record_ts |            TIMESTAMP_LTZ(3) |  TRUE |               | METADATA FROM 'timestamp' |           |
|  flink_proc_time | TIMESTAMP_LTZ(3) *PROCTIME* | FALSE |               |           AS `PROCTIME`() |           |
+------------------+-----------------------------+-------+---------------+---------------------------+-----------+
10 rows in set
So let’s use that in the query and see what happens:
SELECT  window_start,
        window_end,
        COUNT(*) as event_count
FROM TABLE(
        TUMBLE(TABLE orders_kafka,
                DESCRIPTOR(flink_proc_time),
                INTERVAL '1' MINUTE)
        )
GROUP BY window_start, window_end;
At first, we get nothing:
+----+-------------------------+-------------------------+----------------------+
| op |            window_start |              window_end |          event_count |
+----+-------------------------+-------------------------+----------------------+
That’s because Flink waits for the window to close before issuing the result:
+----+-------------------------+-------------------------+----------------------+
| op |            window_start |              window_end |          event_count |
+----+-------------------------+-------------------------+----------------------+
| +I | 2025-04-25 15:11:00.000 | 2025-04-25 15:12:00.000 |                    2 |
Let’s look closely at the window timestamp though: 2025-04-25 15:11 - 2025-04-25 15:12.
Compare that to the timestamps on the record:
|
|
|
|
|
|
The window (15:11) doesn’t encompass either created_at (09:44) nor kafka_record_ts (13:26).
Instead, it’s the time at which we ran it—somewhere between 15:11 and 15:12.
The question we’ve answered here is how many records were processed each minute. What it definitely doesn’t tell us is how many orders were placed each minute (which is what we were trying to answer originally).
For that we need to build a window using a different time field; created_at.
(If we wanted to know how many orders were written to Kafka each minute we’d use kafka_record_ts, if we wanted to know how many orders shipped each minute we’d use shipped_at, and so on).
We saw above already that we can’t just pass a timestamp column to the window aggregation; it has to be a column that has been marked as a time attribute. We don’t want to use a processing time attribute because that doesn’t answer our question; we need to use an event time attribute.
In my mind here is some pseudo-SQL that I’d like to run to define a column as an event time attribute, but is not correct Flink SQL:
-- ⚠️ This is not valid Flink SQL.
ALTER TABLE orders_kafka
    ALTER COLUMN `created_at` TIMESTAMP_LTZ(3) AS EVENT_TIME;
or something like that.
The point being, we never explicitly say this field is the event time attribute.
What we actually do is implicitly mark it as the event time attribute by defining the watermark.
Since there’s a watermark, the column on which the watermark is defined must be the event time.
Obvious, right?!
To mark a column as an event time attribute we need to use the WATERMARK statement.
This is where I think things get a bit confusing until you understand it, and then it’s just… shrugs how Flink is.
Let me explain…
💧 Watermarks in Flink SQL 🔗
When you run a batch query the engine doing the processing knows when it’s read all of the data. Life is simple. Contrast that to a streaming query in which, by definition, the source of the data is unbounded—so there’s no such thing as having "read all the data".

Not only is the source unbounded, but the data may arrive out of order, late, or not at all.

Let’s consider what happens if we want to do some time-based processing based on when the event happened, such as an count of events per minute. For this we’ll need a window for each minute, and then count how many events are in that window.

Here’s the complication. How long do we wait for data until we can consider this window closed? Here’s the first event in the window:

Let’s say we’ll wait five seconds. If we do that then when the next event arrives (and happens to be out of order) it will be included in the window:

The next event has a time of 10:00:06. If we take the five seconds (that we decided was how long we’d wait for data before closing the window) that gives us 10:00:01, which is after the 10:00:00 window close time, and thus we can close the window:

This event is not just out of order, but it is LATE because it arrived for processing AFTER the window in which it belongs was closed. In Flink SQL a late record will be discarded from processing.

So, how do we implement in theory, so that we’re not reliant on wall clock to determine how late is too late to include an out of order record in a window? How do we decide when to close a window, instead of storing it as state until the end of eternity?
Watermarks are a clever idea that tell the processing engine when it’s OK to consider a passage of time as complete. In other words, a watermark tells Flink what the latest time is that we can consider as having seen, allowing for our arbitrary five second delay.

When the out of order event arrives, the watermark doesn’t change because the event time is earlier than the latest that we’ve seen so far

When the event with event time of 10:00:06 arrives the watermark advances to five seconds prior to the event time since this is later than the previous watermark.
Because this is now after the end time of the previous window this causes that window to close.

Because the window has closed the record with event time 09:59:51 is classed as late.
In Flink SQL that means it will be discarded.
The watermark remains unchanged.

| The above diagrams are, as is the case with these things, simplified to try and cover the broader point. In practice a watermark is not generated per-event unless Flink is configured to do so. |
This is why when we create a table in Flink SQL we can’t just define a column as an event time attribute on its own; we need to define the watermark generation strategy that goes with it so that Flink knows when to have considered all data as having been read for a given period of that event time.
Where we set the watermark is up to us. Set a watermark too short and whilst you’ll get your final result quicker you’re much more likely to have incomplete data because anything arriving late will be ignored. Then again, set the watermark too long you’ll increase the chances of getting a complete set of data, but at the expense of the result taking longer to finalise.
Which is right? That depends on you and your business process :)
|
To learn more about watermarks in detail check out these excellent resources: |
One thing to be aware of is that there is a difference between records that are late and those that are out of order. In Flink SQL if a record is late then it is discarded, whilst if it is just out of order then it means it arrived after an earlier record, but is still included in processing. This is where the watermark generation strategy comes in; if you generate watermarks too quickly (in order to cause a window to close sooner) you slide the scale away from completeness and potentially more records are classed as late and thus discarded. If the watermark period is longer, those same records arriving at the same point in the stream would instead be out of order and thus your completeness is higher (at the expense of latency). The video linked to above explains this difference well; skip to 3:29 if you just want the bit about late vs out of order.
So, watermarks are a thing—and we need to configure them. If we’re going to be pernickity about terminology, we’re not defining the watermark per se, but the watermark generation strategy.
ALTER TABLE orders_kafka
    ADD WATERMARK FOR `created_at` AS `created_at` - INTERVAL '5' SECOND;
This basically tells Flink that it needs to give a five-second leeway when processing created_at for any out of order records to arrive on the stream.
| There is actually a lot more nuance to how it works, and complexities if you have partitioned input too. The Flink docs cover these well, as do these videos. |
With the event time attribute defined on the table (by virtue of us having set the WATERMARK), let’s try our windowed aggregation again, reverting to using created_at by which the aggregate is generated:
SELECT  window_start,
        window_end,
        COUNT(*) as event_count
FROM TABLE(
        TUMBLE(TABLE orders_kafka,
                DESCRIPTOR(created_at),
                INTERVAL '1' MINUTE)
        )
GROUP BY window_start, window_end;
But this happens…
+----+-------------------------+-------------------------+----------------------+
| op |            window_start |              window_end |          event_count |
+----+-------------------------+-------------------------+----------------------+
No rows get emitted.

We can start to debug this by removing the aggregation and looking at the columns that the table valued function (TVF) return about the window, and also add the CURRENT_WATERMARK detail:
SELECT  order_id,
        created_at,
        window_start,
        window_end,
        CURRENT_WATERMARK(created_at) AS CURRENT_WATERMARK
FROM TABLE(
            TUMBLE(TABLE orders_kafka,
                    DESCRIPTOR(created_at),
                    INTERVAL '1' MINUTE)
            );
+----------+-------------------------+-------------------------+-------------------------+-------------------+
| order_id |              created_at |            window_start |              window_end | CURRENT_WATERMARK |
+----------+-------------------------+-------------------------+-------------------------+-------------------+
|        1 | 2025-04-25 09:44:25.000 | 2025-04-25 09:44:00.000 | 2025-04-25 09:45:00.000 |            <NULL> |
|        2 | 2025-04-25 09:44:28.000 | 2025-04-25 09:44:00.000 | 2025-04-25 09:45:00.000 |            <NULL> |
So we can see that the orders are being bucketed into the correct time window based on created_at; but CURRENT_WATERMARK is NULL, which I’m guessing is why I don’t get any rows emitted for my aggregate.
Why is there no watermark (i.e. CURRENT_WATERMARK is NULL)?
Well, the devil is in the detail, and there are two factors at play here.
Idle partitions 🔗
If you’re working with Kafka as a source to Flink, it’s vital to be aware of what’s known as the "idle stream problem". This is expertly described here. In short, it occurs when the Kafka source hasn’t sent a watermark from each and every partition yet.
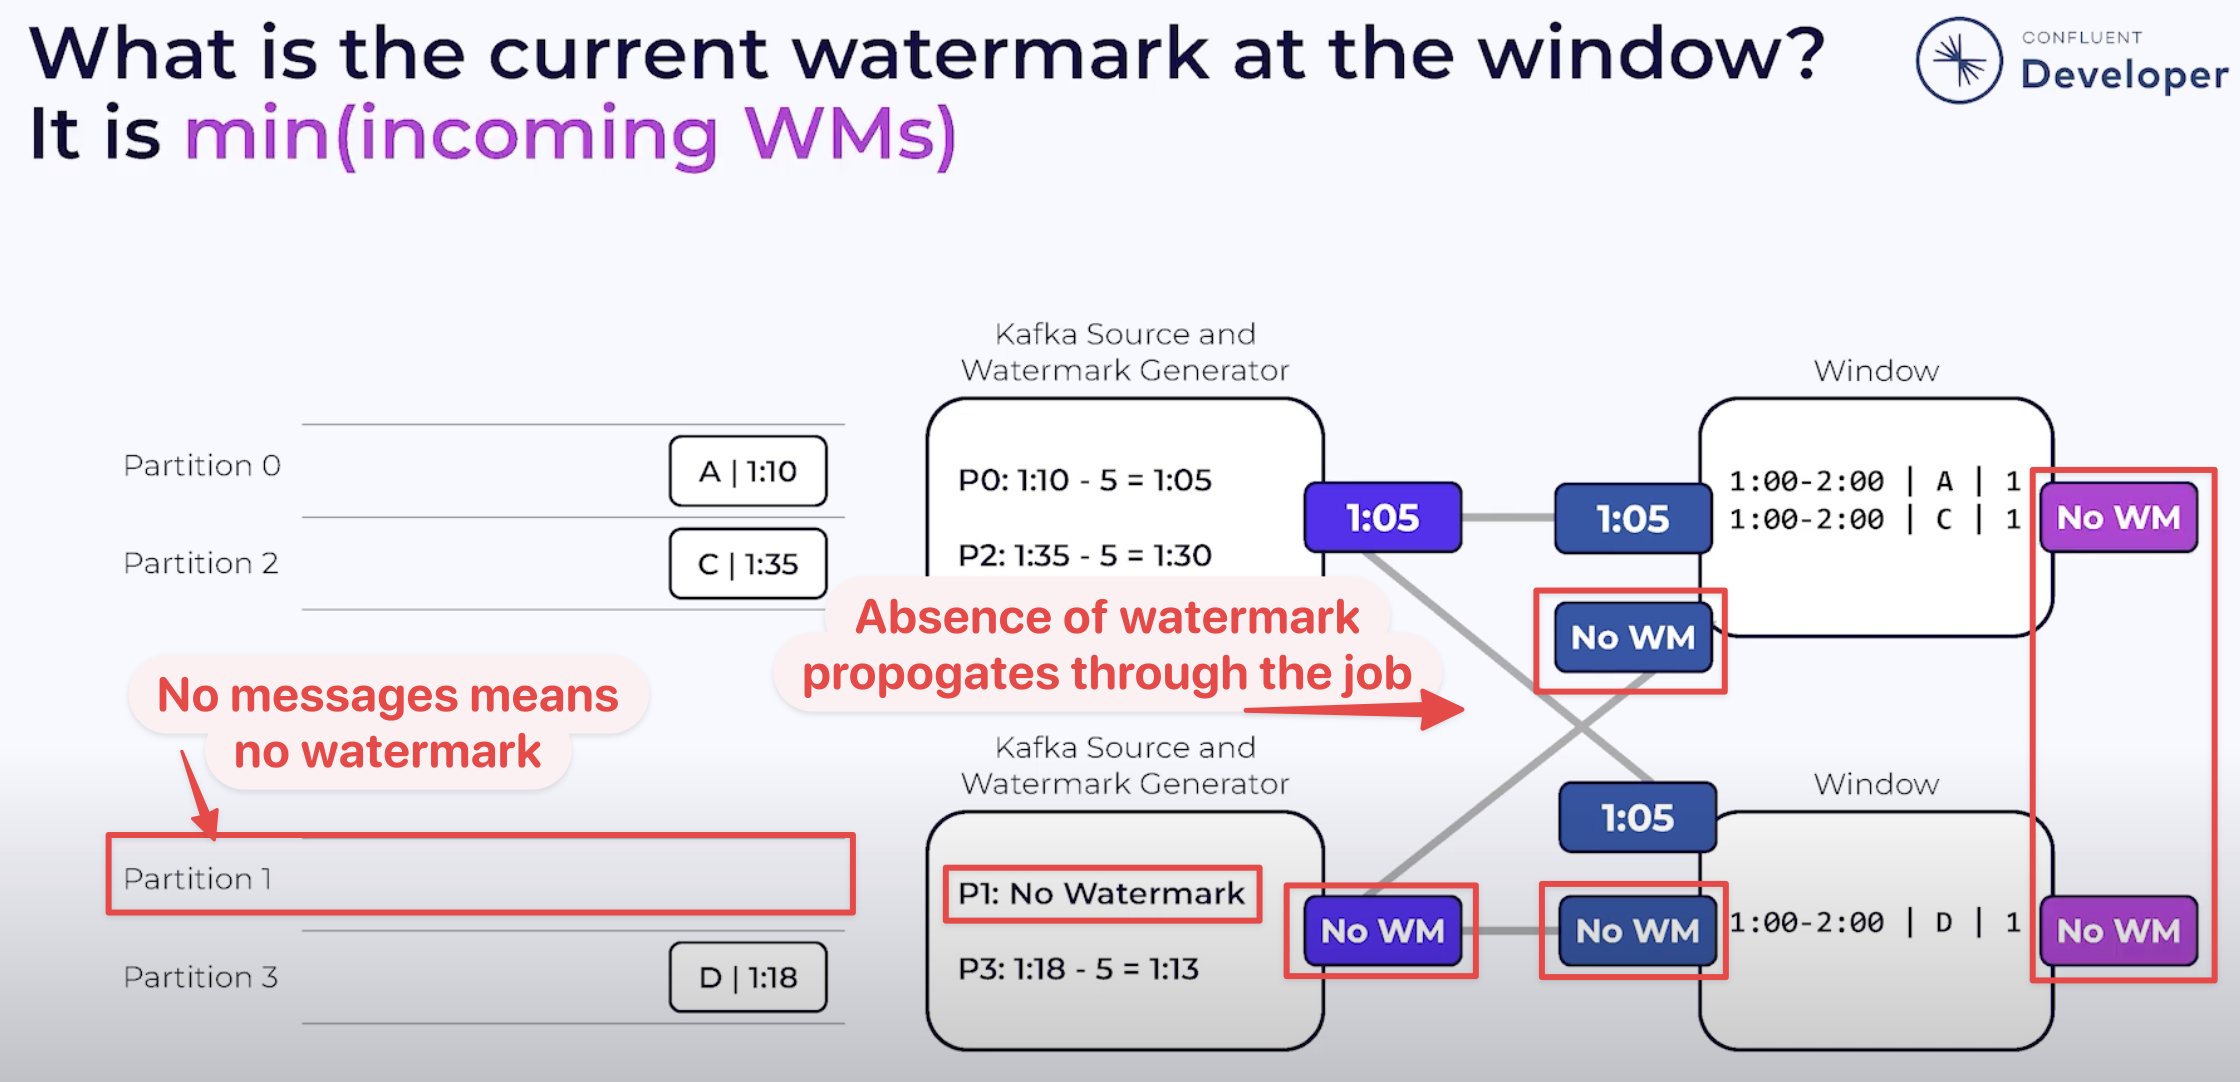
The watermark at each stage of the execution (known as an 'operator') is the minimum of the watermarks across the source partitions. The crucial point here is that if there is no data flowing through one (or more) partitions, that means that no watermark is generated by them either. This means that the watermark for the operator is not updated.
| 🎥 To learn more about how a query gets executed, the concept of operators, and logical job graphs, check out this excellent talk from Danny Cranmer. |
To see how this impacts our situation let’s first check the number of partitions on the source topic:
$ docker compose exec -it kcat kcat -b broker:9092 -LMetadata for all topics (from broker 1: broker:9092/1):
1 brokers:
broker 1 at broker:9092 (controller)
1 topics:
topic "orders_cdc" with 3 partitions:
partition 0, leader 1, replicas: 1, isrs: 1
partition 1, leader 1, replicas: 1, isrs: 1
partition 2, leader 1, replicas: 1, isrs: 1This shows that there are three partitions. To check if we are getting data from each of them we can bring the partition in as a metadata column (like we did for the message timestamp above):
ALTER TABLE orders_kafka
    ADD topic_partition INT METADATA FROM 'partition';
And now run the same query, but showing the partitions for each row to check the message partition assignments:
SELECT  order_id,
        topic_partition,
        created_at,
        CURRENT_WATERMARK(created_at) AS CURRENT_WATERMARK,
        window_start,
        window_end
FROM TABLE(
            TUMBLE(TABLE orders_kafka,
                    DESCRIPTOR(created_at),
                    INTERVAL '1' MINUTE)
);+----------+-----------------+-------------------------+------------------------+-------------------------+-------------------------+
| order_id | topic_partition | created_at | CURRENT_WATERMARK | window_start | window_end |
+----------+-----------------+-------------------------+------------------------+-------------------------+-------------------------+
| 1 | 0 | 2025-04-25 09:44:25.000 | <NULL> | 2025-04-25 09:44:00.000 | 2025-04-25 09:45:00.000 |
| 2 | 2 | 2025-04-25 09:44:28.000 | <NULL> | 2025-04-25 09:44:00.000 | 2025-04-25 09:45:00.000 |This shows that there’s no messages on partition 1, and thus no watermark is getting generated for the operator.
One option here is just to add data to the partition and thus cause a watermark to be generated.
The partition is set based on the key of the Kafka message, which is order_id.
If we add more orders (causing order_id to change), then we should soon end up with an order on partition 1.
What I see after adding a row to the partition is this—even though it’s in partition 1, still no watermark (based on CURRENT_WATERMARK being NULL)
+----------+-----------------+-------------------------+------------------------+-------------------------+-------------------------+
| order_id | topic_partition |              created_at |      CURRENT_WATERMARK |            window_start |              window_end |
+----------+-----------------+-------------------------+------------------------+-------------------------+-------------------------+
[…]
|        5 |               1 | 2025-04-25 09:46:01.000 |                 <NULL> | 2025-04-25 09:46:00.000 | 2025-04-25 09:47:00.000 |
When I add another row, I then get a watermark:
+----------+-----------------+-------------------------+-------------------------+-------------------------+-------------------------+
| order_id | topic_partition |              created_at |       CURRENT_WATERMARK |            window_start |              window_end |
+----------+-----------------+-------------------------+-------------------------+-------------------------+-------------------------+
[…]
|        6 |               1 | 2025-04-25 09:46:06.000 | 2025-04-25 09:44:20.000 | 2025-04-25 09:46:00.000 | 2025-04-25 09:47:00.000 |
We’ll come back to this point (that is, why we only see CURRENT_WATERMARK after a second insert) shortly.
First though, we’ve seen that the reason we weren’t getting a watermark generated was an idle partition; there was no record in partition 1, and so no watermark passed downstream to the watermark for the operator.
To deal with this we can configure an idle timeout which tells the downstream watermark generator to ignore any missing watermarks after the amount of time specified.
The configuration property is scan.watermark.idle-timeout and can be set as a query hint, or a table property:
ALTER TABLE orders_kafka
    SET ('scan.watermark.idle-timeout'='5sec');
To test this out I reset the source topic, and added rows afresh, one by one. First, no watermark:
+----------+-----------------+-------------------------+-------------------------+-------------------------+-------------------------+
| order_id | topic_partition |              created_at |       CURRENT_WATERMARK |            window_start |              window_end |
+----------+-----------------+-------------------------+-------------------------+-------------------------+-------------------------+
|        1 |               0 | 2025-04-25 09:44:25.000 |                  <NULL> | 2025-04-25 09:44:00.000 | 2025-04-25 09:45:00.000 |
but then, a watermark (note that there’s only data on two of the three partitions; this is the scan.watermark.idle-timeout taking effect):
+----------+-----------------+-------------------------+-------------------------+-------------------------+-------------------------+
| order_id | topic_partition |              created_at |       CURRENT_WATERMARK |            window_start |              window_end |
+----------+-----------------+-------------------------+-------------------------+-------------------------+-------------------------+
|        1 |               0 | 2025-04-25 09:44:25.000 |                  <NULL> | 2025-04-25 09:44:00.000 | 2025-04-25 09:45:00.000 |
|        2 |               2 | 2025-04-25 09:44:28.000 | 2025-04-25 09:44:20.000 | 2025-04-25 09:44:00.000 | 2025-04-25 09:45:00.000 |
Let’s now look at why CURRENT_WATERMARK isn’t being set on the first row—and in the example above, why it took a second row being added to partition 1 for CURRENT_WATERMARK to be set.
When does a watermark get generated in Flink? 🔗
As described here, the watermark is generated by the source (the Kafka connector, in this case). It’s generated based on the watermark generation strategy specified in the DDL.
We’ve specified our watermark generation strategy as a bounded out of orderness one. That is, events might be out of order, but we’re specifying a bound to how long we will wait for late events:
`created_at` - INTERVAL '5' SECONDThis means that the watermark is generated based on the value of created_at that’s read by the source, minus five seconds.
The wrinkle here is that by default the watermark is not created immediately when the first row of data is read. Per the docs:
For sql tasks, watermark is emitted periodically by default, with a default period of 200ms, which can be changed by the parameter pipeline.auto-watermark-interval
Since the CURRENT_WATERMARK function in a query returns the watermark at the time that the row is emitted to the query output, and thus if it’s the very beginning of the execution can mean that a watermark hasn’t been generated yet.
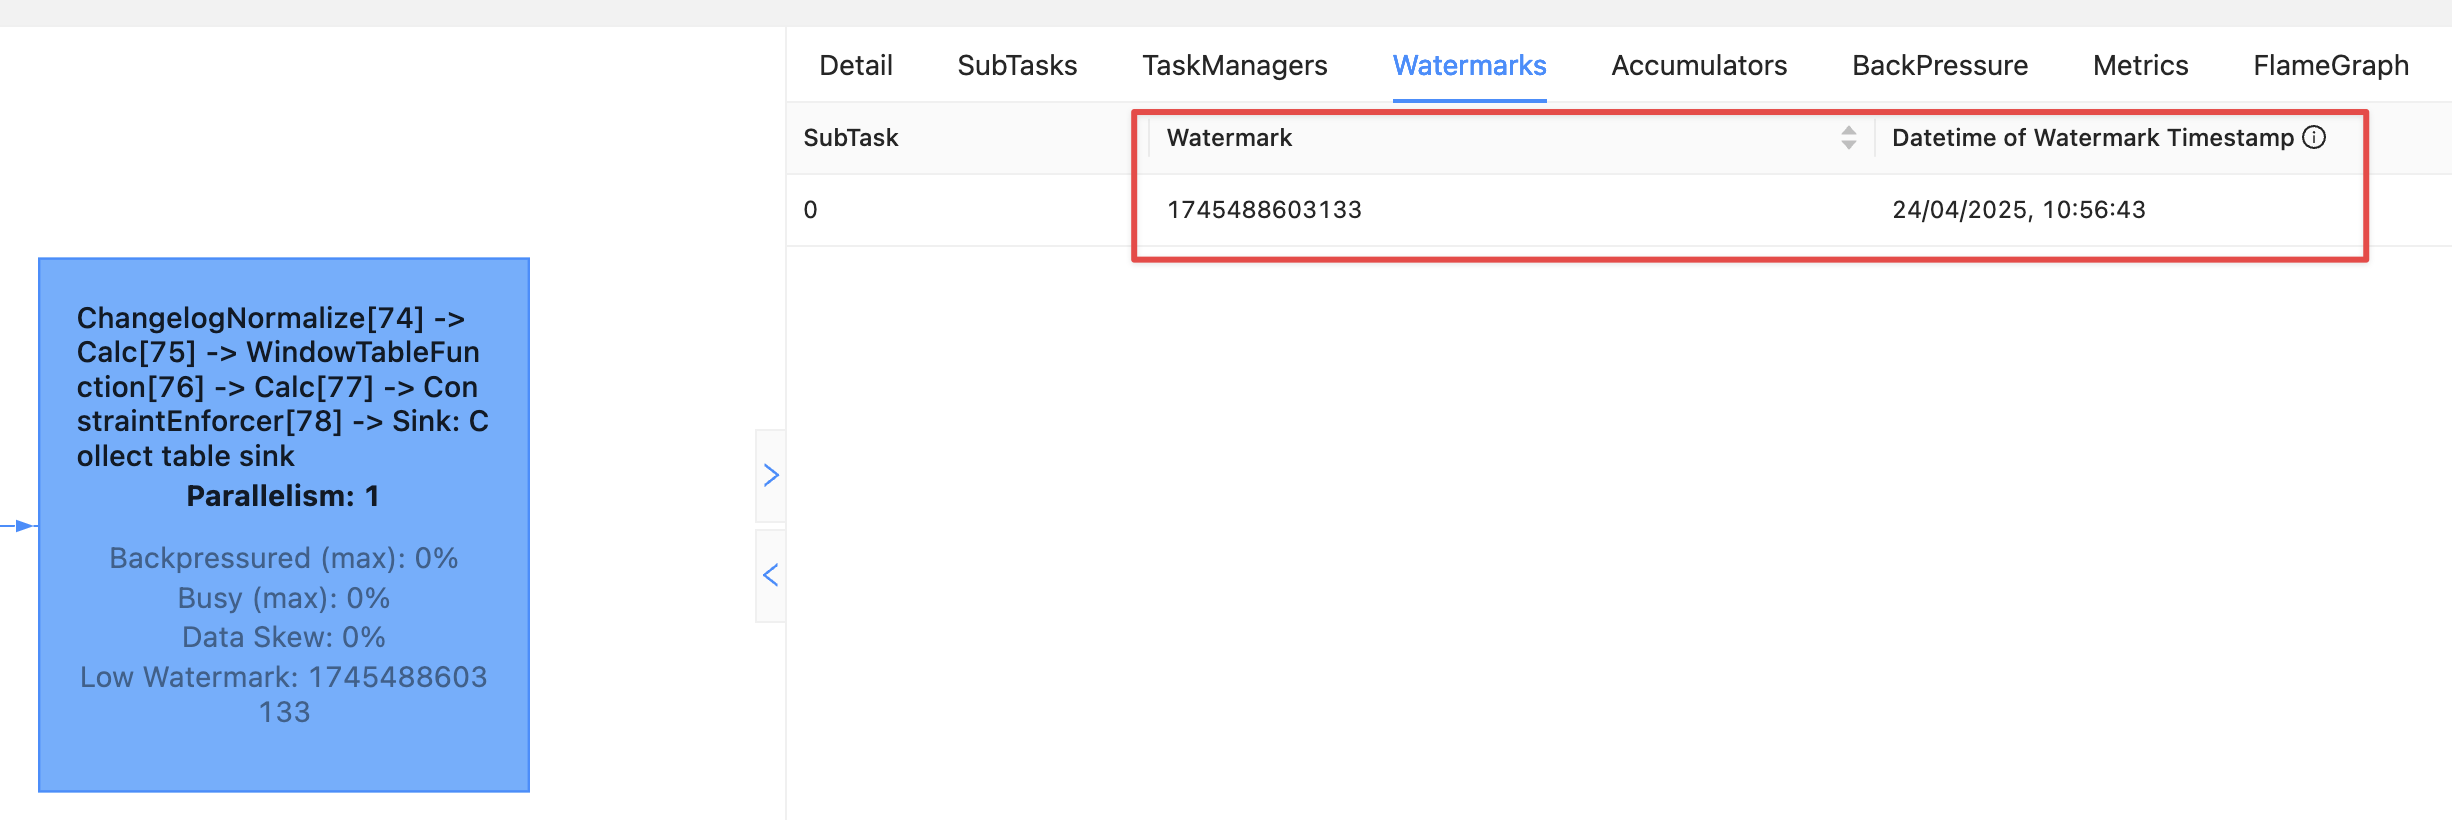
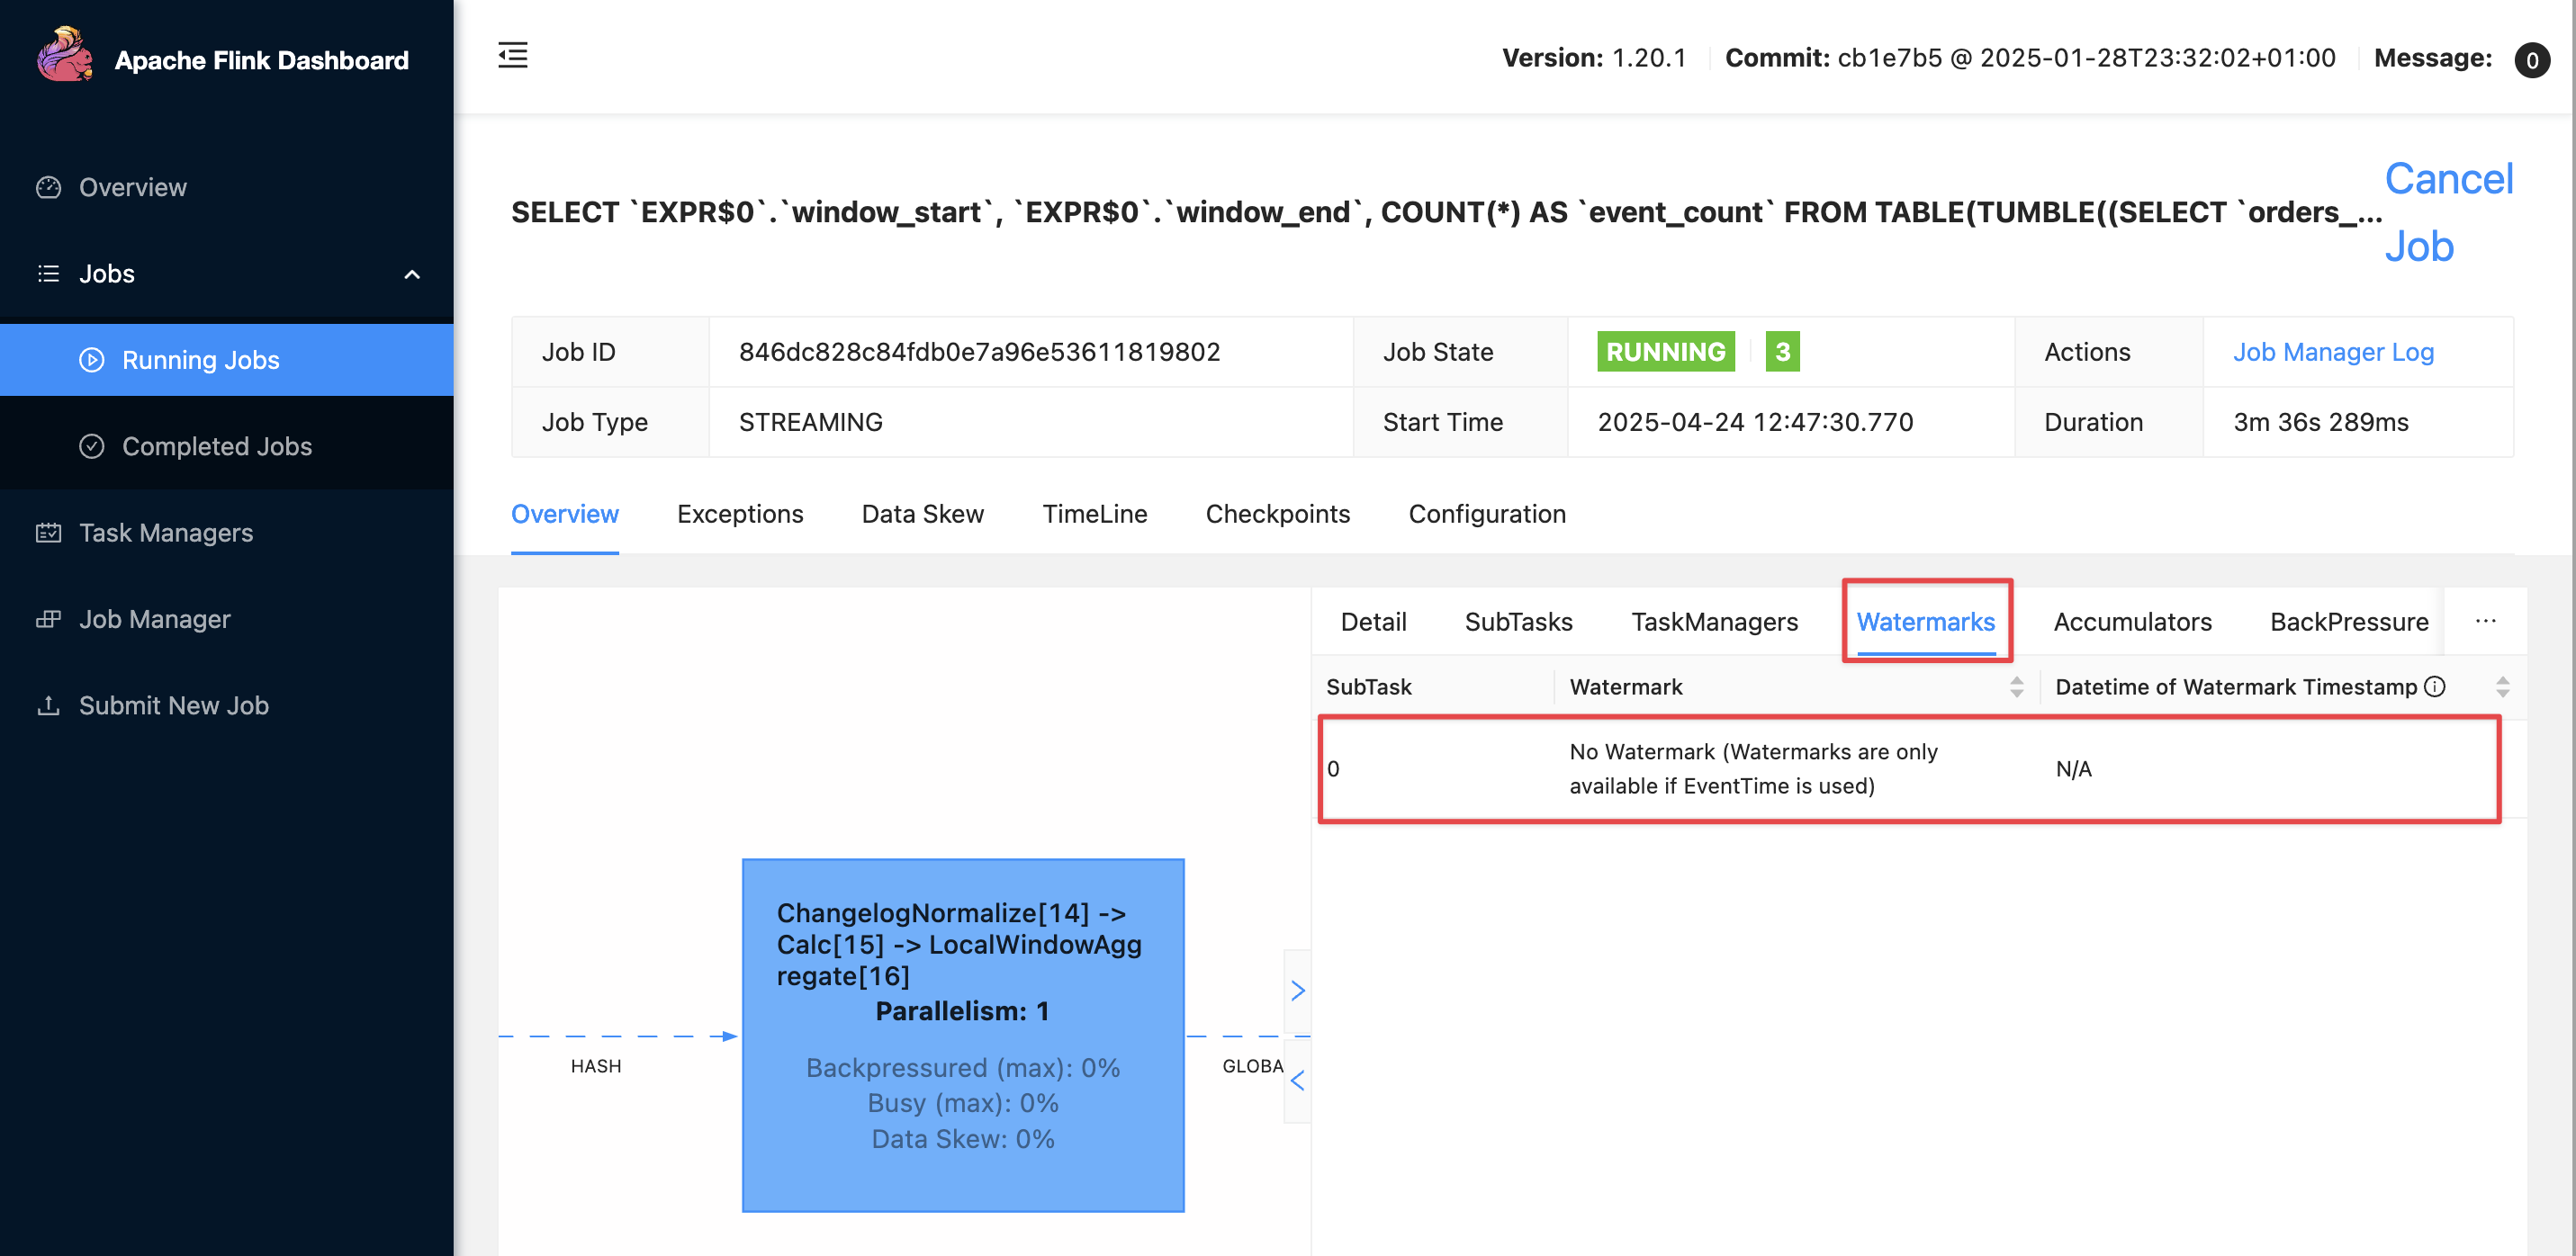
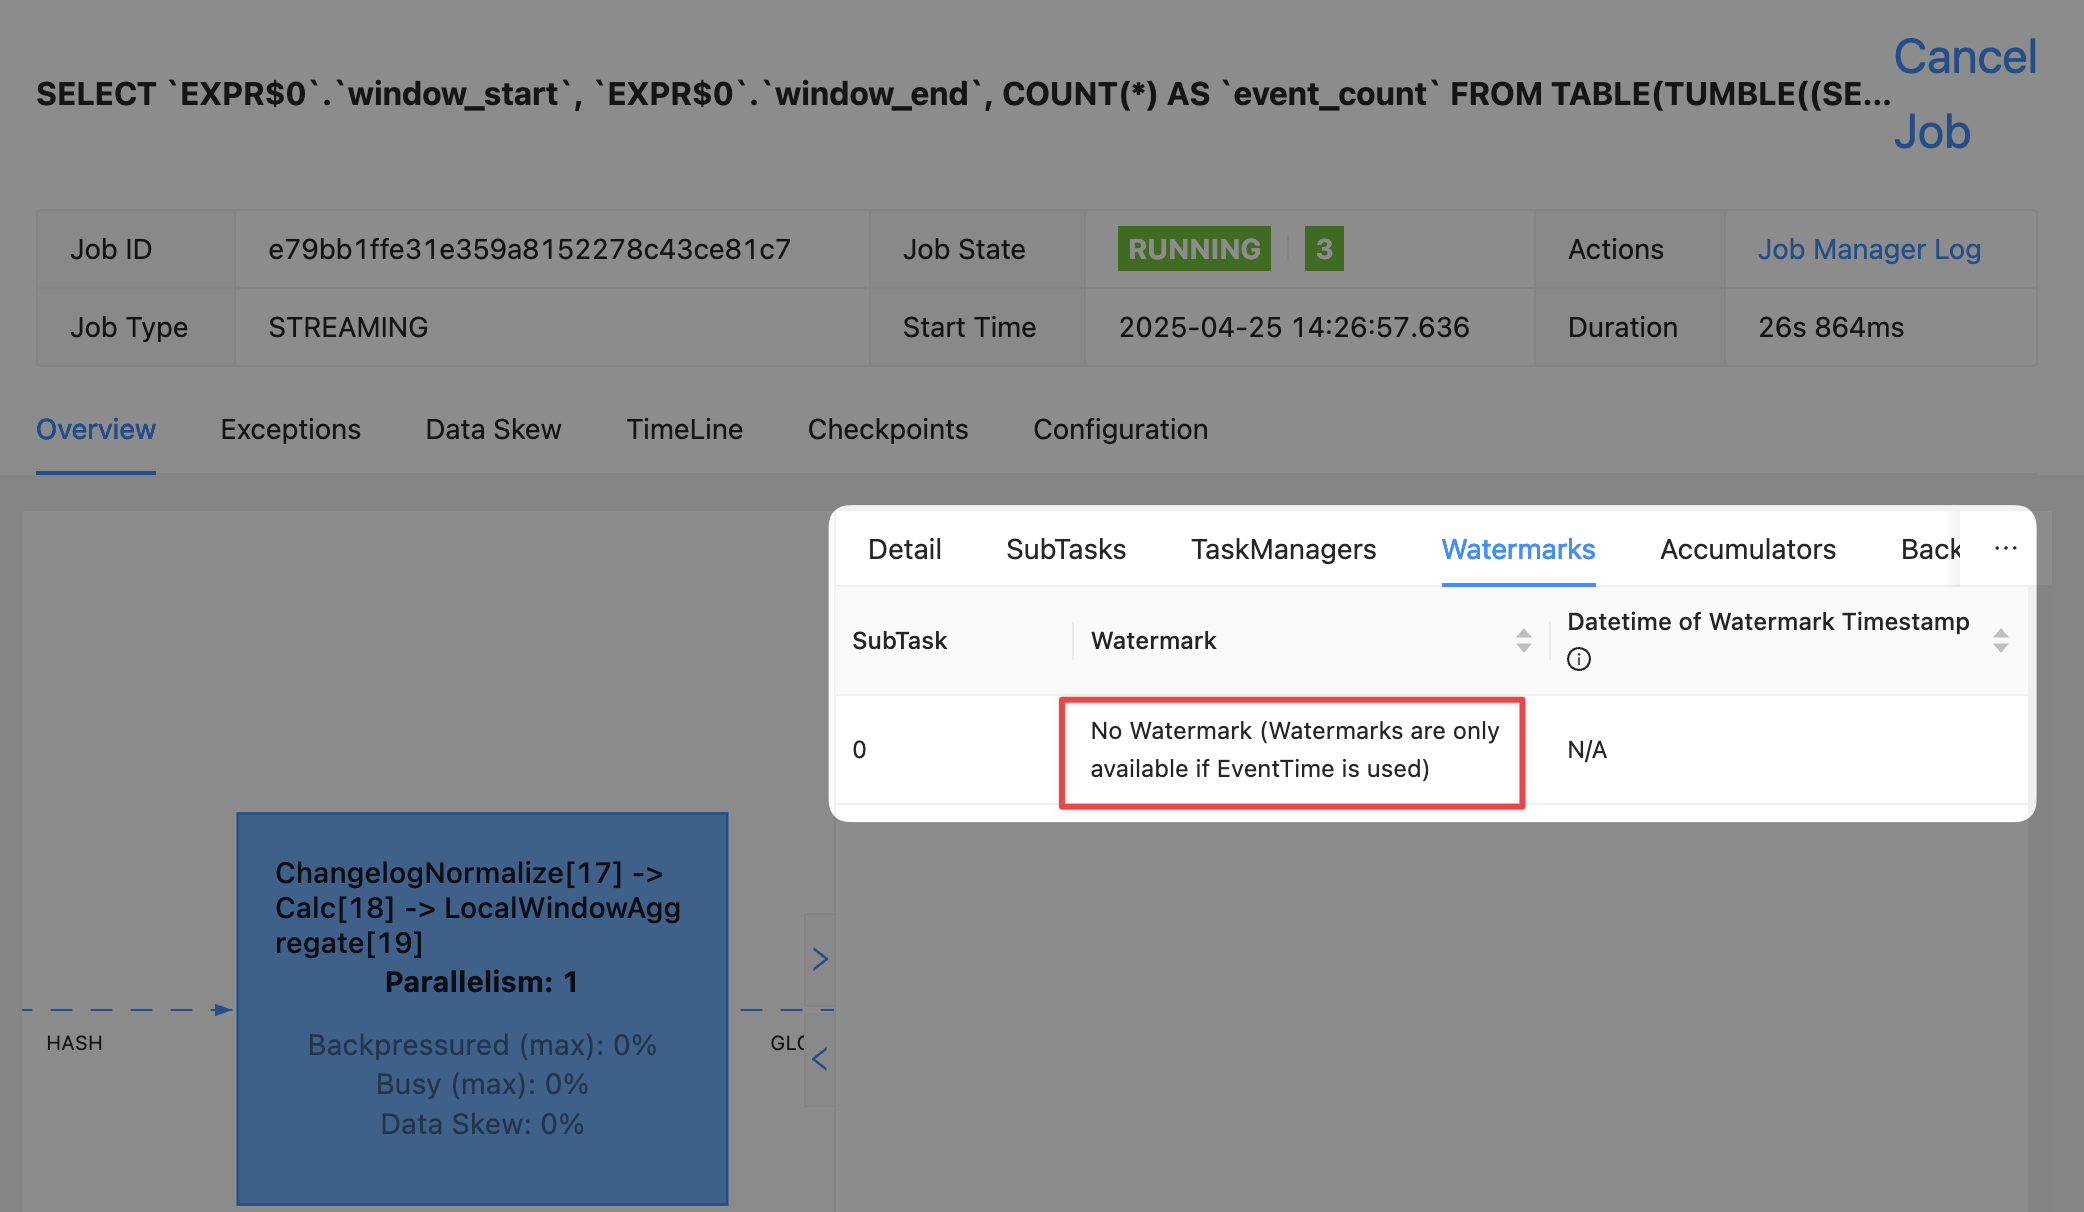
There is a cleaner way to look at the current watermark; through the Flink UI:
If there is no watermark then it looks like this:
Putting it into practice 🔗
These two 'nuances' to Flink watermarking (idle partitions, and observing the current watermark/auto-watermark-interval) are somewhat circularly interlinked.
Now that we’ve considered each on their own, let’s apply it to the problems we saw above.
Here’s the same query as above, with no idle timeout set, and as we saw before CURRENT_WATERMARK is NULL which is what we’d expect.
SELECT order_id,
        topic_partition,
        created_at,
        CURRENT_WATERMARK(created_at) AS CURRENT_WATERMARK,
        window_start,
        window_end
FROM TABLE(
            TUMBLE(TABLE orders_kafka,
                    DESCRIPTOR(created_at),
                    INTERVAL '1' MINUTE)
            );
+-------------+-----------------+-------------------------+-------------------------+-------------------------+-------------------------+
| order_id | topic_partition | created_at | CURRENT_WATERMARK | window_start | window_end |
+-------------+-----------------+-------------------------+-------------------------+-------------------------+-------------------------+
| 2 | 2 | 2025-04-25 09:44:28.000 | <NULL> | 2025-04-25 09:44:00.000 | 2025-04-25 09:45:00.000 |
| 1 | 0 | 2025-04-25 09:44:25.000 | <NULL> | 2025-04-25 09:44:00.000 | 2025-04-25 09:45:00.000 |The idle timeout can be set as a table property, but also through a query hint. This has the benefit of proving the difference without needing to change the table definition. In theory it could be that you want to use a different watermark configuration for different uses of the table too.
Here’s the same query, with a hint:
SELECT /*+ OPTIONS('scan.watermark.idle-timeout'='5sec') */
order_id,
topic_partition,
created_at,
CURRENT_WATERMARK(created_at) AS CURRENT_WATERMARK,
window_start,
window_end
FROM TABLE(
TUMBLE(TABLE orders_kafka,
DESCRIPTOR(created_at),
INTERVAL '1' MINUTE)
);The results in the SQL client look the same:
+-------------+-----------------+-------------------------+-------------------------+-------------------------+-------------------------+
|    order_id | topic_partition |              created_at |       CURRENT_WATERMARK |            window_start |              window_end |
+-------------+-----------------+-------------------------+-------------------------+-------------------------+-------------------------+
|           2 |               2 | 2025-04-25 09:44:28.000 |                  <NULL> | 2025-04-25 09:44:00.000 | 2025-04-25 09:45:00.000 |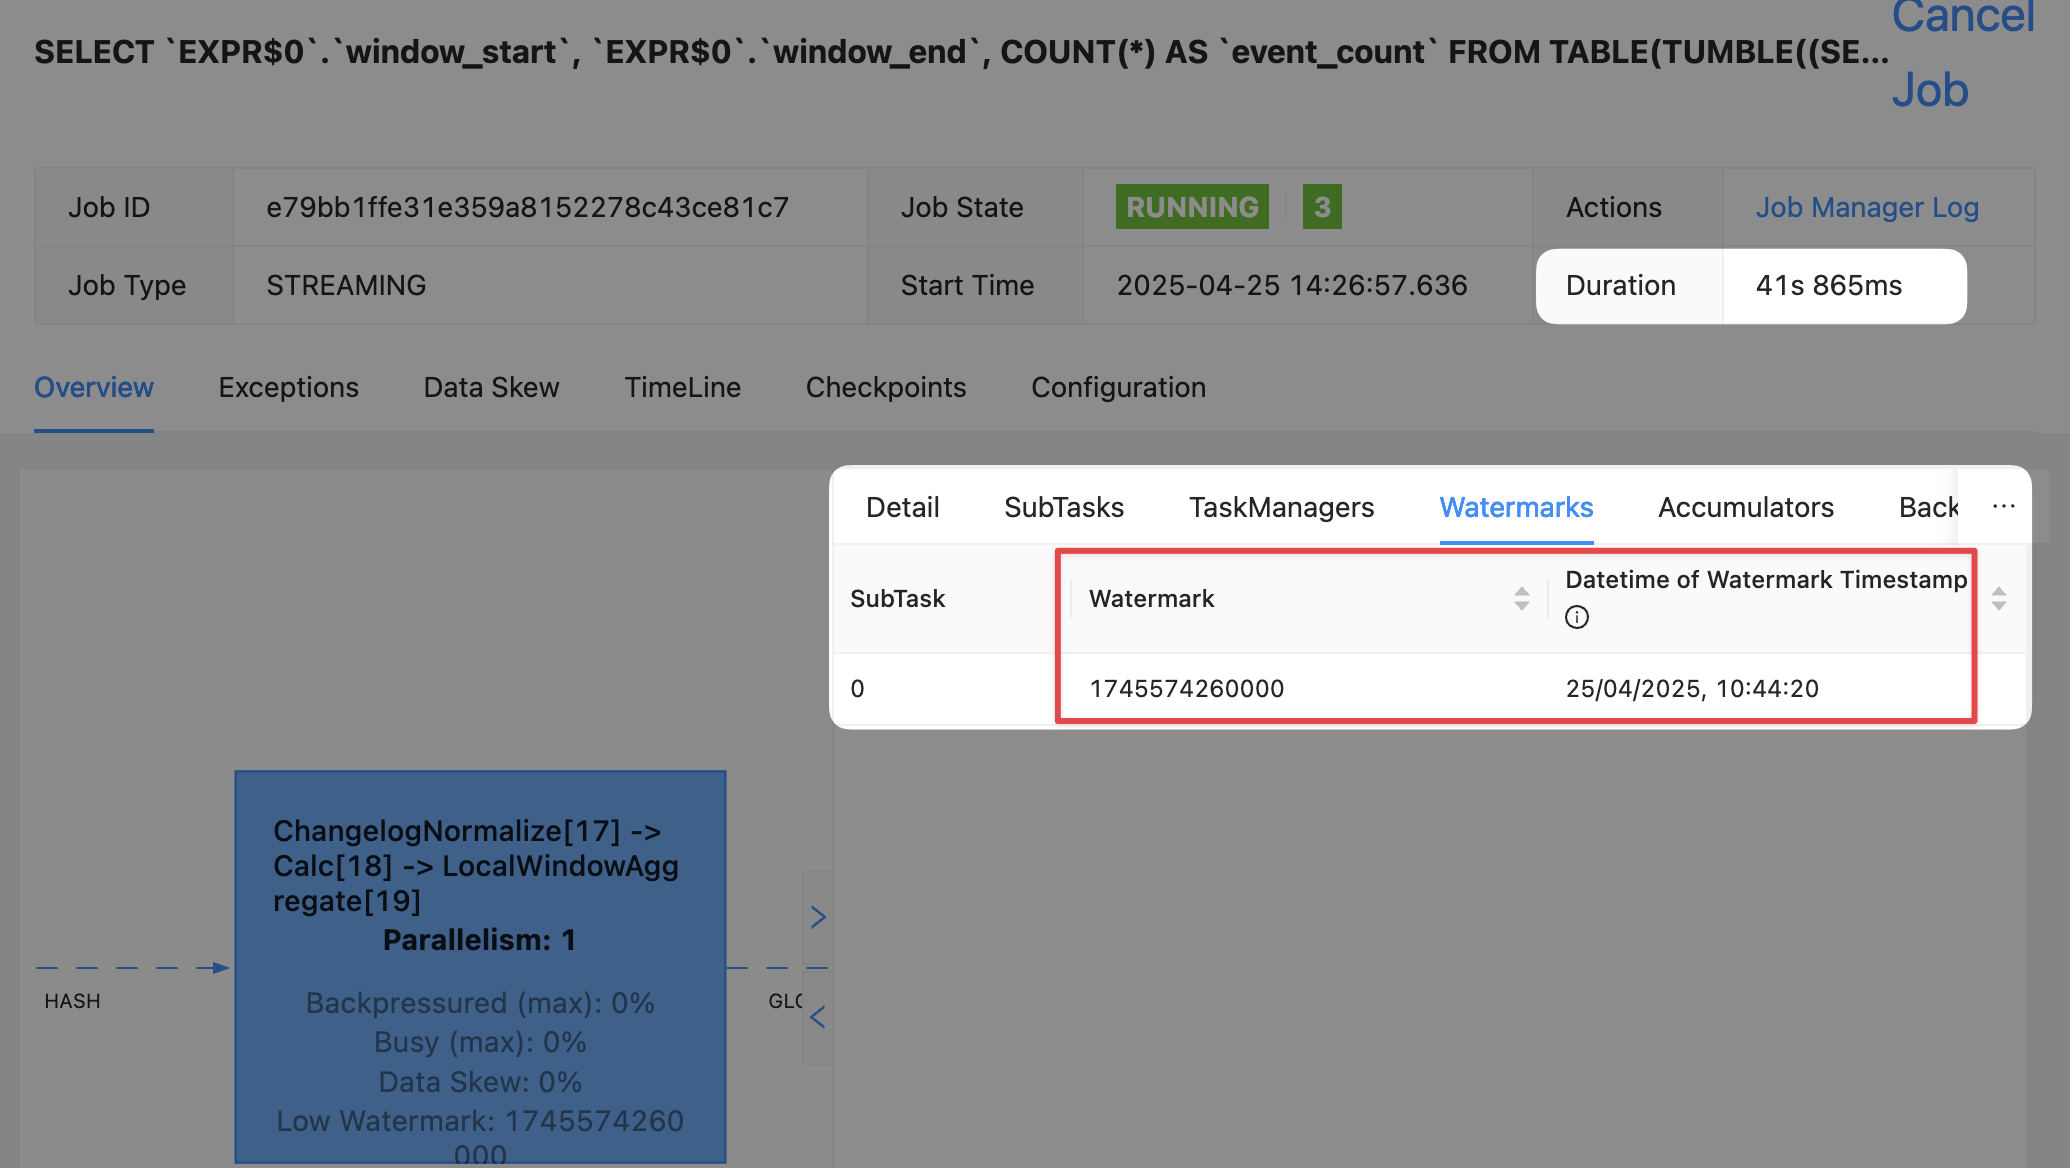
| 1 | 0 | 2025-04-25 09:44:25.000 | <NULL> | 2025-04-25 09:44:00.000 | 2025-04-25 09:45:00.000 |But crucially, over in the Flink UI we can inspect the actual watermark for each operator:
The watermark rendered locally in my browser is 25/04/2025, 10:44:20, which is in BST (UTC+1).
This comes from the lowest of the upstream watermarks, of which there are two.
These watermarks are the highest value of created_at for each partition, with the watermark generation strategy applied, which was
`created_at` - INTERVAL '5' SECONDThus partition 0’s watermark (09:44:25 minus 5 seconds) is used: 2025-04-25 09:44:20.000 UTC
So back to where we were: a tumbling time window 🔗
From the above we’ve learnt two things:
-
We need to understand the impact of an idle partition on the watermark that’s generated for each operator. By setting
scan.watermark.idle-timeoutas a query hint we can see if it resolves the problem, and if it does, modify the table’s properties:ALTER TABLE orders_kafka SET ('scan.watermark.idle-timeout'='30 sec'); -
CURRENT_WATERMARKis useful but only once a query is 'warmed up'; at the beginning, or for a very sparse number of records, the row it is emitted with in a query may not reflect the watermark that follows from the logical implications of the row itself. For example, even if the row emitted is for a previously-idle partition and thus a watermark would be expected, it may not be reflected inCURRENT_WATERMARKin that row.In this situation a more reliable way to examine the watermark can be through the Flink UI as this is updated continually and does not rely on a row being emitted from the query itself.
Here’s the current state of the table’s definition; we’ve marked the created_at column as an event time attribute by virtue of having defined a watermark generation strategy on it (`created_at` AS ), and we’ve configure a timeout to avoid an idle partition blocking a watermark from being generated.created_at - INTERVAL '5' SECOND
CREATE TABLE `orders_kafka` (
    `order_id` INT NOT NULL,
    `customer_id` INT,
    `total_amount` DECIMAL(10, 2),
    `status` VARCHAR(2147483647),
    `created_at` TIMESTAMP(3),
    `shipped_at` TIMESTAMP(3),
    `shipping_address` VARCHAR(2147483647),
    `payment_method` VARCHAR(2147483647),
    `topic_partition` INT METADATA FROM 'partition',
    WATERMARK FOR `created_at` AS `created_at` - INTERVAL '5' SECOND,
    CONSTRAINT `PK_order_id` PRIMARY KEY (`order_id`) NOT ENFORCED
) WITH (
    'properties.bootstrap.servers' = 'broker:9092',
    'connector' = 'upsert-kafka',
    'value.format' = 'json',
    'key.format' = 'json',
    'topic' = 'orders_cdc',
    'scan.watermark.idle-timeout' = '30 sec'
);
Now for our original tumbling window query, to answer the question: how many orders have been created each minute?
SELECT  window_start,
        window_end,
        COUNT(*) as event_count
FROM TABLE(
        TUMBLE(TABLE orders_kafka,
                DESCRIPTOR(created_at),
                INTERVAL '1' MINUTE)
        )
GROUP BY window_start, window_end;
But…still nothing
This time (sorry…) though, I know why! Or at least, I think I do.
Here are the two rows of data currently in the source topic:
SELECT  order_id,
        topic_partition,
        created_at,
        window_start,
        window_end
FROM TABLE(
            TUMBLE(TABLE orders_kafka,
                    DESCRIPTOR(created_at),
                    INTERVAL '1' MINUTE)
            );
+-------------+-----------------+-------------------------+-------------------------+-------------------------+
| order_id | topic_partition | created_at | window_start | window_end |
+-------------+-----------------+-------------------------+-------------------------+-------------------------+
| 2 | 2 | 2025-04-25 09:44:28.000 | 2025-04-25 09:44:00.000 | 2025-04-25 09:45:00.000 |
| 1 | 0 | 2025-04-25 09:44:25.000 | 2025-04-25 09:44:00.000 | 2025-04-25 09:45:00.000 |There is a window that we’re expecting to get emitted in our query.
It starts at 09:44 and ends a minute later (defined by INTERVAL '1' MINUTE in the TUMBLE part of the query) at 09:45.
The window will get emitted once it’s considered 'closed'; that is, the watermark has passed the window_end time.
It’s worth reiterating here because it’s so crucial to understanding what’s going on: the query emits results based on the watermark. The watermark is driven by event time and not wall clock.
So whilst I’ve just inserted these two rows of data, I can wait until kingdom come; just because a minute has passed on the wallclock, nothing is getting emitted until the watermark moves on past the end of the window.
What’s the current watermark?
It should be the lower of the watermarks across the partitions, which as we can see from the table of data here is going to be 2025-04-25 09:44:25.000 minus five seconds (which is our declared watermark generation strategy), thus 2025-04-25 09:44:20.000.
If that is the case, then the watermark of the operator (09:44:20) will not be later than the window end time (09:45:00), and thus nothing can be emitted yet.
Let’s check what the current watermark is to determine if my wild guesseducated reasoning is correct:
😓 Oh no! I was wrong…or was I?
😅 Because just a short while (roughly 30 seconds) later what do I see but this:
Taking into account the timezone offset (UTC+1) I was right! The current watermark is 25/04/2025, 09:44:20
Why the delay? Because the watermark is only generated after the idle timeout period (30 seconds) has passed.

Monitoring the watermark 🔗
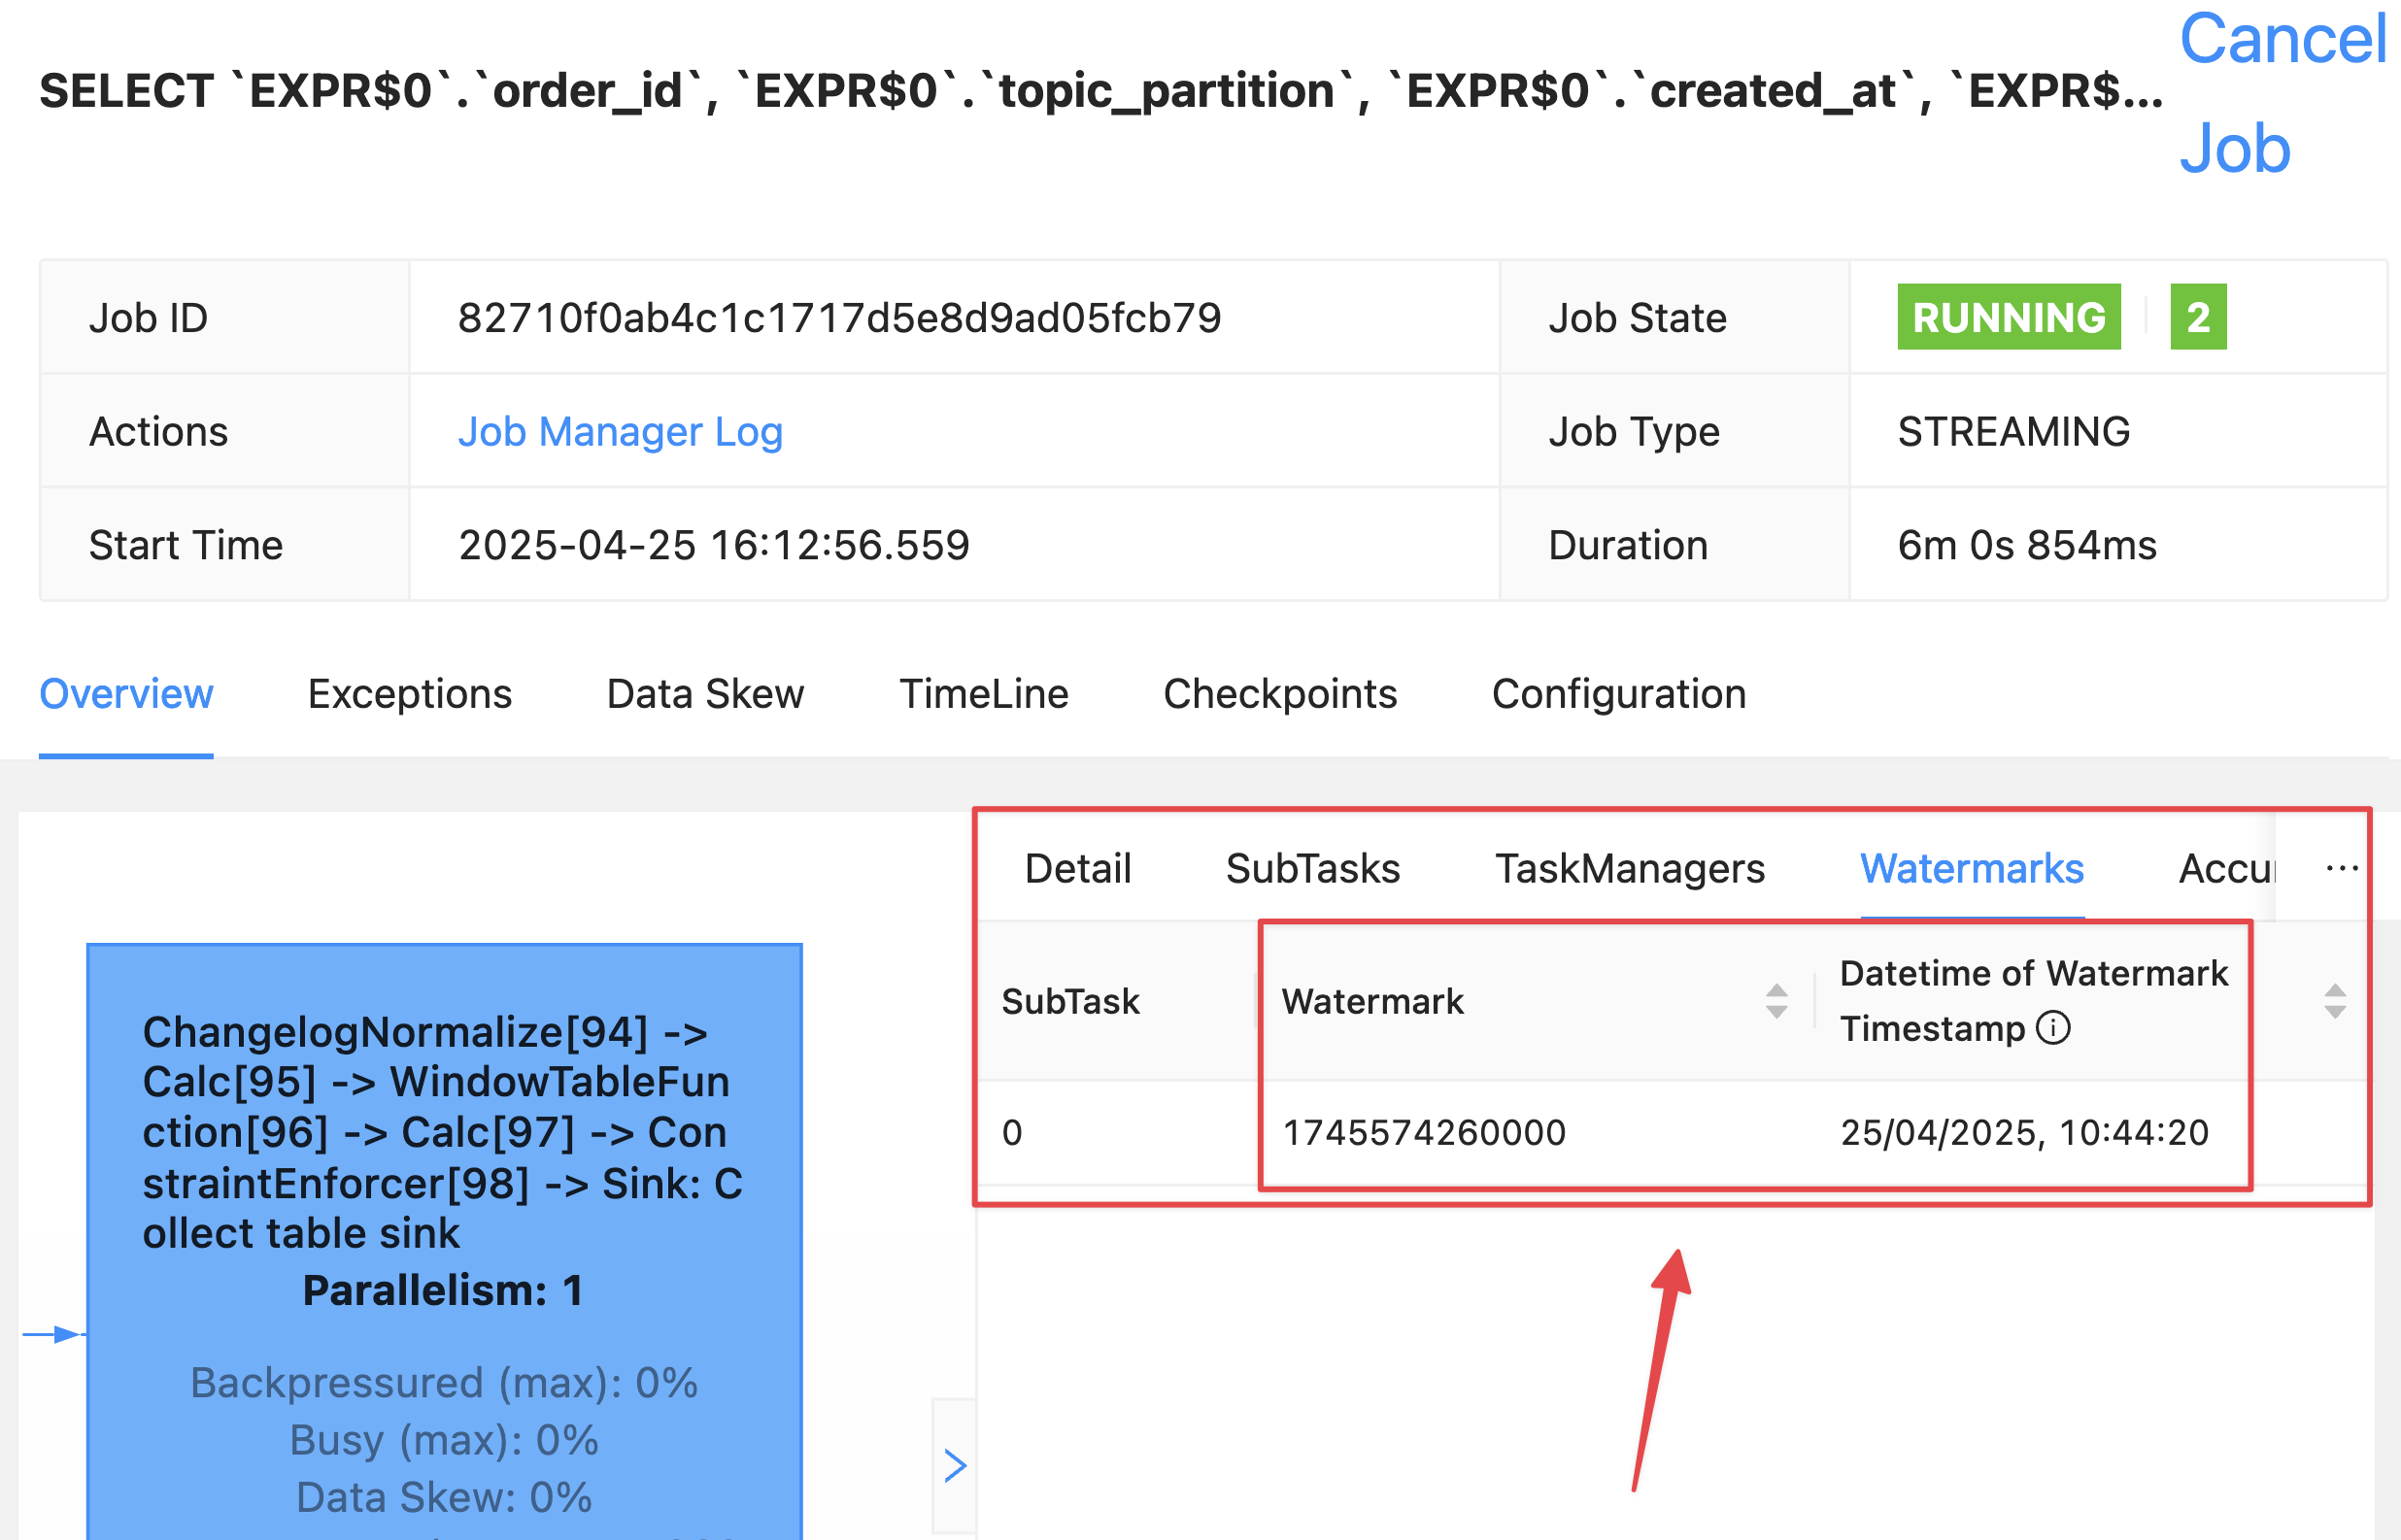
Here’s a trick for monitoring the watermark—use the REST API. This is what the Flink UI is built on, and is also documented.
You can get the REST call from the Flink UI (use DevTools to copy the /watermarks call made when you click on the subtask). You can also construct it by figuring out the job and operator ("vertex") ID from the /jobs API endpoint.
The REST call using httpie will look like this:
$ http http://localhost:8081/jobs/e79bb1ffe31e359a8152278c43ce81c7/vertices/19843528532cdce10b652a1bfda378b5/watermarks
HTTP/1.1 200 OK
access-control-allow-origin: *
connection: keep-alive
content-length: 58
content-type: application/json; charset=UTF-8
[
{
"id": "0.currentInputWatermark",
"value": "1745574260000"
}
]With some jq magic we can wrap it in a watch statement to update automagically:
$ watch http "http://localhost:8081/jobs/e79bb1ffe31e359a8152278c43ce81c7/vertices/19843528532cdce10b652a1bfda378b5/watermarks \
| jq '.[].value |= (tonumber / 1000 | todate)'"[
{
"id": "0.currentInputWatermark",
"value": "2025-04-25T09:44:20Z"
}
]Back to the tumbling window 🔗
So how do we move the watermark on and get some data emitted from the tumbling window? First off, we need a new watermark to be generated. When Flink SQL is reading from Kafka a watermark is only generated when the Kafka consumer reads a message. No new messages, no updated watermark.
The generated watermark is the lowest (earliest) of the upstream watermarks (i.e. per partition), which are in turn the latest value seen of created_at minus five seconds.
Note that this excludes idle partitions.
An idle partition could be one in which there’s no data, but it could also be a partition with data but for which no new data has been received within the configured scan.watermark.idle-timeout time.
This makes sense if you step back and think about what the whole point of watermarks is; to provide a mechanism for handling late and out-of-order data. What Flink is doing is saying "I cannot close this window yet because one or more of the partitions have not told me that it’s got all the data [because the watermark for that partition has not passed the window close time]". It’s also saying "Regardless of the watermark generation policy (5 seconds in our case), I’m going to class any partitions have have not produced any data for a given period of time (30 seconds in our case) as idle, and so ignore their watermark when generating the downstream watermark".
So if I add one more row of data with a more recent created_at outside of the window it’s not necessarily going to cause the window to close.
Why not?
Because in the other partitions the watermark is still going to be earlier.
But if it’s more than the idle timeout (scan.watermark.idle-timeout) that partition’s watermark gets disregarded, and so the new row will cause the window to close.
Let’s add the row of data.
It’s several minutes since I created the previous ones.
Remember, created_at is an event time, not wall clock time.
That said, the idle timeout is based on wall clock time.
Fun, huh!
Here’s the data now:
+-------------+-----------------+-------------------------+-------------------------+-------------------------+
|    order_id | topic_partition |              created_at |            window_start |              window_end |
+-------------+-----------------+-------------------------+-------------------------+-------------------------+
|           2 |               2 | 2025-04-25 09:44:28.000 | 2025-04-25 09:44:00.000 | 2025-04-25 09:45:00.000 |
|           1 |               0 | 2025-04-25 09:44:25.000 | 2025-04-25 09:44:00.000 | 2025-04-25 09:45:00.000 |
| 3 | 2 | 2025-04-25 09:45:33.000 | 2025-04-25 09:45:00.000 | 2025-04-25 09:46:00.000 |So in partition 2 the watermark is 2025-04-25 09:45:28 (2025-04-25 09:45:33 minus five seconds) and in partition 0 the watermark would be 2025-04-25 09:44:20.000 except the partition has idled out (scan.watermark.idle-timeout) and so in effect is the same as partition 1—idle, and so not included in the calculation of the generated watermark:
http "http://localhost:8081/jobs/e79bb1ffe31e359a8152278c43ce81c7/vertices/19843528532cdce10b652a1bfda378b5/watermarks \
| jq '.[].value |= (tonumber / 1000 | todate)'"[
{
"id": "0.currentInputWatermark",
"value": "2025-04-25T09:45:28Z"
}
]Since 09:45:28 is outside the window end, we get our windowed aggregate emitted!
+-------------------------+-------------------------+----------------------+
| window_start | window_end | event_count |
+-------------------------+-------------------------+----------------------+
| 2025-04-25 09:44:00.000 | 2025-04-25 09:45:00.000 | 2 |Now let’s add a record within the next window (09:45-09:46):
+-------------+-----------------+-------------------------+-------------------------+-------------------------+
|    order_id | topic_partition |              created_at |            window_start |              window_end |
+-------------+-----------------+-------------------------+-------------------------+-------------------------+
|           2 |               2 | 2025-04-25 09:44:28.000 | 2025-04-25 09:44:00.000 | 2025-04-25 09:45:00.000 |
|           1 |               0 | 2025-04-25 09:44:25.000 | 2025-04-25 09:44:00.000 | 2025-04-25 09:45:00.000 |
|           3 |               2 | 2025-04-25 09:45:33.000 | 2025-04-25 09:45:00.000 | 2025-04-25 09:46:00.000 |
| 4 | 2 | 2025-04-25 09:45:38.000 | 2025-04-25 09:45:00.000 | 2025-04-25 09:46:00.000 |The watermark is now 2025-04-25 09:45:33 (2025-04-25 09:45:38 minus 5 seconds).
If we want to make this window (09:45-09:46) emit a row we need to cause the watermark to be greater than 09:46:00, so we’ll add a record with a created_at of 09:46:06
+-------------+-----------------+-------------------------+-------------------------+-------------------------+
| order_id | topic_partition | created_at | window_start | window_end |
+-------------+-----------------+-------------------------+-------------------------+-------------------------+
| 2 | 2 | 2025-04-25 09:44:28.000 | 2025-04-25 09:44:00.000 | 2025-04-25 09:45:00.000 |
| 1 | 0 | 2025-04-25 09:44:25.000 | 2025-04-25 09:44:00.000 | 2025-04-25 09:45:00.000 |
| 3 | 2 | 2025-04-25 09:45:33.000 | 2025-04-25 09:45:00.000 | 2025-04-25 09:46:00.000 |
| 4 | 2 | 2025-04-25 09:45:38.000 | 2025-04-25 09:45:00.000 | 2025-04-25 09:46:00.000 |
| 5 | 1 | 2025-04-25 09:46:06.000 | 2025-04-25 09:46:00.000 | 2025-04-25 09:47:00.000 |The watermark moves on to 2025-04-25 09:46:01 and the aggregate window gets emitted:
+-------------------------+-------------------------+----------------------+
|            window_start |              window_end |          event_count |
+-------------------------+-------------------------+----------------------+
| 2025-04-25 09:44:00.000 | 2025-04-25 09:45:00.000 |                    2 |
| 2025-04-25 09:45:00.000 | 2025-04-25 09:46:00.000 | 2 |☺️ Phew. Eighteen months since starting to learn Flink…I think I understand watermarks :) 🔗

It’s taken a while, and a lot of scratching around and reading and asking smart people (huge kudos to colleague and Flink community member David Anderson), but I feel like I understand watermarks—or if not, I at least know which corners to go poking in next time I get stumped by them.
If you’re wanting to understand watermarks properly my advice would be thus:
-
Read and watch these excellent resources. And then go and do it again.
-
Fire up the Flink UI and poke around the watermarks tab with a set of data in which you’ve fixed the event time. This makes it much easier to replicate and try out different settings. If you use an event time that’s not fixed (such as Kafka timestamp and you’re inserting new records each time) you are, as they say, peeing in the wind. And we know how messy that can get.
I’ve put the Docker Compose that I used to run all the above tests on GitHub, so you can run it and explore to your heart’s content. -
Read the fine documentation. It’s not ideal that the information is spread across the docs how it is, but that is how it is, so deal with it or file a PR :)
My thanks to David Anderson and Gunnar Morling for their help with this article.