OBIEE benchmarks
Here’s a list of the OBIEE benchmark documents published by Oracle:
30 articles in this category
Here’s a list of the OBIEE benchmark documents published by Oracle:
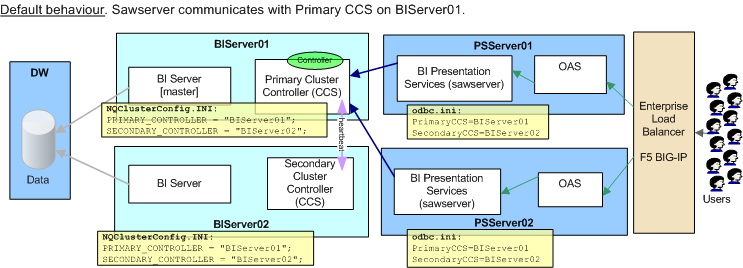
Production cluster is 2x BI Server and 2x Presentation Services, with a BIG-IP F5 load balancer on the front.

Users started reporting slow login times to BI. Our monitoring tool (Openview) reported that “BIServer01 may be down. Failed to contact it using ping.”. BIServer01 cannot be reached by ping or ssh from Windows network.
nqsserver and nqsclustercontroller on BIServer01 was logging these repeated errors:
[nQSError: 12002] Socket communication error at call=send: (Number=9) Bad file number
UPDATED: See a HOWTO for OBIEE and LoadRunner here: /2009/10/01/performance-testing-obiee-using-hp-performance-center-a.k.a.-loadrunner/
This is following on from my first post about OBIEE and LoadRunner, in which I failed dismally to get a simple session replaying.
In a nutshell where I’d got to was using the “Web (Click and Script)” function which worked fine for logging in but when running a report resulted in an error on the rendered page. Digging around showed the error was from the javascript of the OBIEE front end.
UPDATED: See a HOWTO for OBIEE and LoadRunner here
LoadRunner is a tool from HP (bought from Mercury) that can be used to simulate user activity. It supports a whole host of protocols but for OBIEE I’m obviously using the Web one.
There are two flavours, “Web (Click and Script)” and “Web (HTTP/HTML)”. The latter simply shoves HTTP requests at the server, whereas “Click and Script” simulates mouse and keyboard entry and thus is more appropriate for this user-based application. [edit]I’m not sure if this is actually the case[/edit]
OBIEE’s Systems Management component exposes configuration and performance data through Java MBeans. As discussed in other posts these can be be accessed through several different ways:
Since it’s a standard java technology being used we can in theory use anything that is designed for monitoring mbeans via jmx. Doing some Googling I discovered jManage.
Yet another way to access the BI Management data discussed here - through Windows’ PerfMon tool.
This will only work for installations where your OBIEE server is running on Windows. You should be able to run PerfMon locally or remotely. Standard practise would be not to run it locally on a Production machine :-)
To run PerfMon go to Start->Run and enter perfmon, or navigate Start -> Settings -> Control Panel -> Administrative Tools -> Performance
Part of looking at the various gubbins inside OBIEE led me to realise that the Oracle BI Management application drives quite a few things. It exposes MBeans (Management Beans, a java term), accessible through jmx. In the installation of OBIEE this component is referred to as “Systems Management”.
The MBeans give us real-time performance information, along with access to all the configuration options that are normally done through config files (instanceconfig.xml etc). Bear in mind if using it for updating configuration instead of through the files you don’t get any backup created, so for that reason alone I would suggest it should only be used for reading current values.
A few points to add to my previous posting on JConsole:

As a kid I loved the idea of lego where you can disassemble and reassemble something from the ground up. As soon as I got my hands on a computer it was the same. You can have your Acorn Archimedes with its games, where do I find the sprites and sound files behind it? Likewise Microsoft Word, let me at the VBA underneath to hack it around and see what else it can do.
[edit] See this post too [/edit] On an OBIEE server run [sourcecode language=“bash”] nohup obiee/systemsmanagement/runagent.sh & [/sourcecode] and then run jconsole (make sure you’ve set the DISPLAY first if you’re running it from UNIX). NB: if you don’t have jconsole in your path you can search for it: [sourcecode language=“bash”] $whereis jconsole jconsole: /opt/java1.5/bin/jconsole /opt/java6/bin/jconsole</span> [/sourcecode] You should find it under your java/bin directory
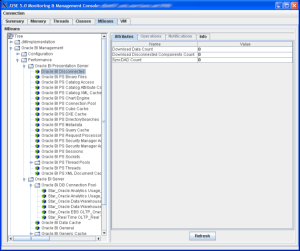
You should get this kind of connection dialog:  Click connect, and the console will launch. From here click on the MBeans tab, where you’ve got access to performance and configuration data